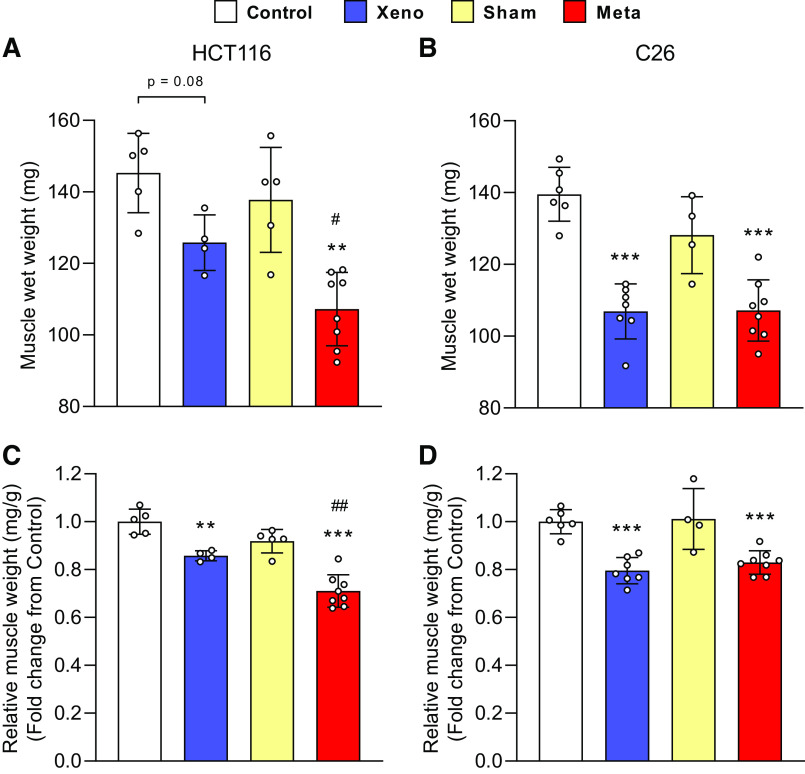
Figure 1.
Skeletal muscle wasting is exacerbated in mHCT116 compared with xHCT116 but is similar in the C26 model. Muscle wet weight of gastrocnemius muscle in HCT116 (A) and C26 models (B). Gastrocnemius muscle mass was normalized to the initial body weight for the HCT116 (C) and C26 models (D). Data are expressed as fold change from controls ± SD. A two-way ANOVA followed by a Tukey’s multiple comparisons test was performed for all direct comparisons between groups. Significant difference from control: *P ≤ 0.05, **P < 0.01, and ***P < 0.001; xenograft vs. metastasis: #P < 0.05, ##P < 0.01.

