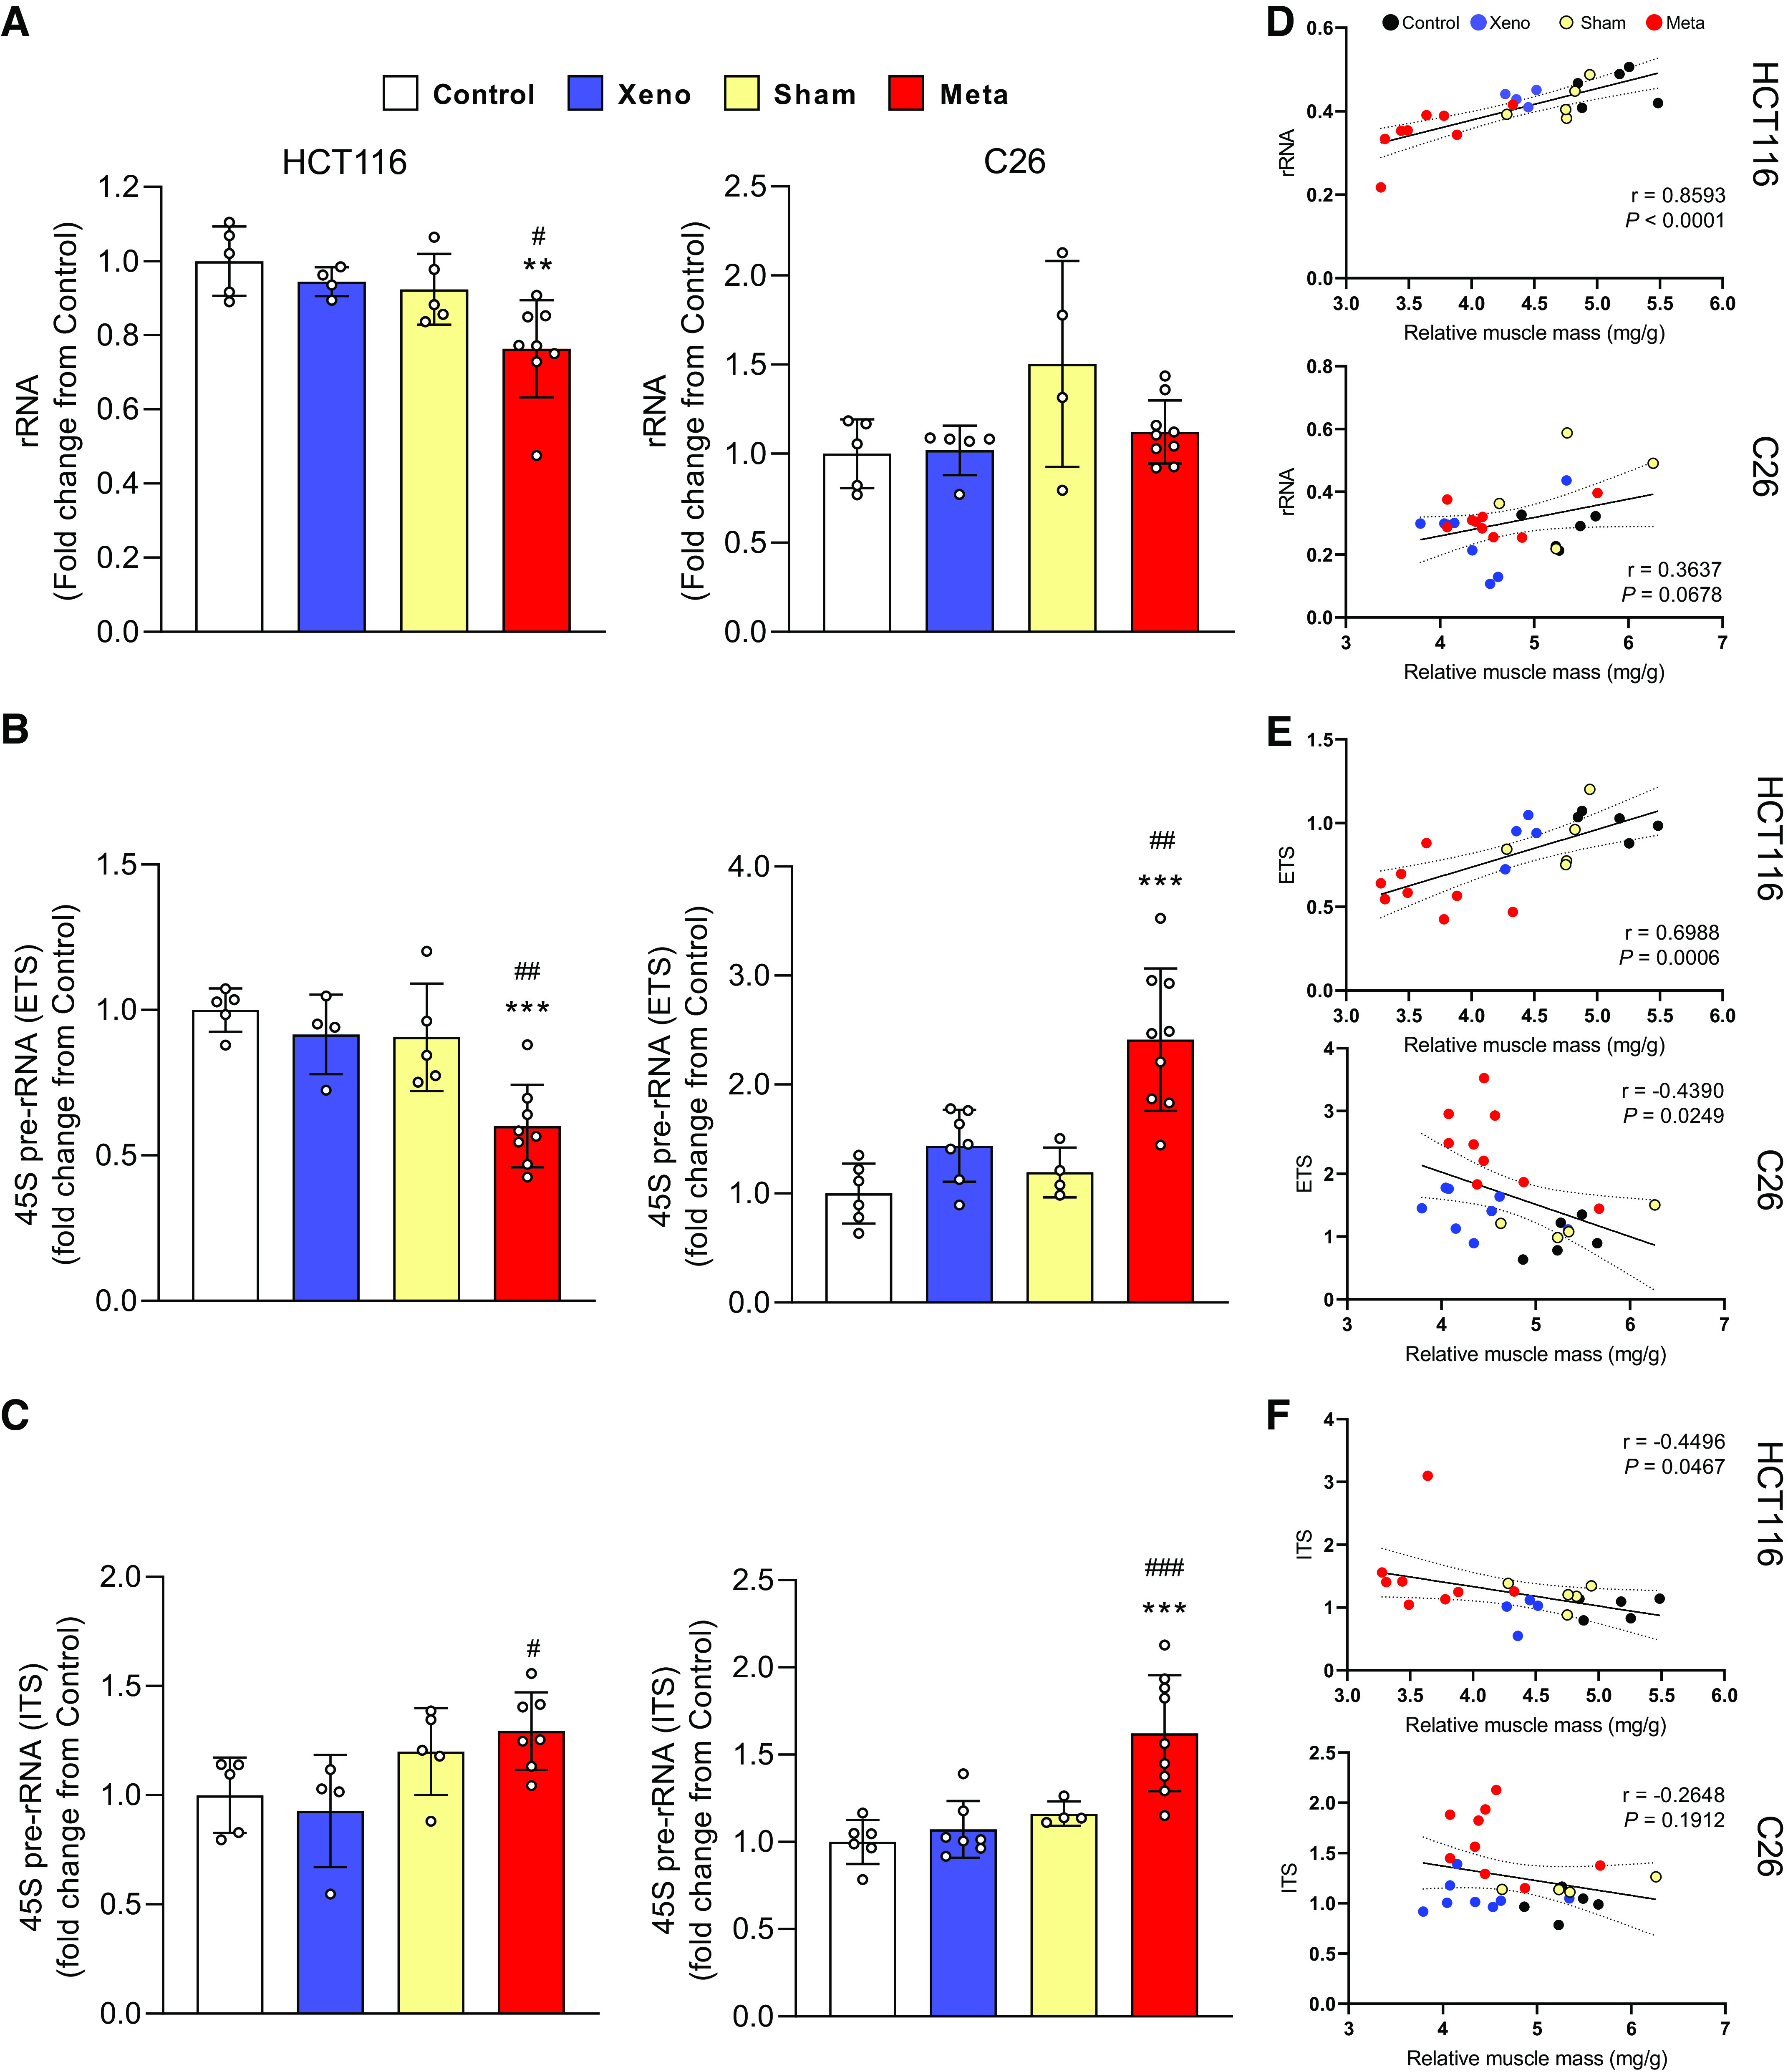
Figure 2.

Ribosomal capacity and rDNA transcription are reduced in mHCT116, but C26 tumors display elevated rDNA transcription and maintain rRNA levels. A: total rRNA content was quantified to compare between groups. Expression of 45S pre-rRNA 5′ external transcribed spacer (ETS; B) and internal transcribed spacers (ITS; C) were analyzed by qPCR. D–F: Pearson product-moment correlations between each factor and muscle mass, respectively. Data are expressed as fold change from controls ± SD. A two-way ANOVA followed by a Tukey’s multiple comparisons test was performed for all direct comparisons between groups. Significant difference from control: *P ≤ 0.05, **P < 0.01, and ***P < 0.001; xenograft vs. metastasis: #P < 0.05, ##P < 0.01, and ###P < 0.001.
