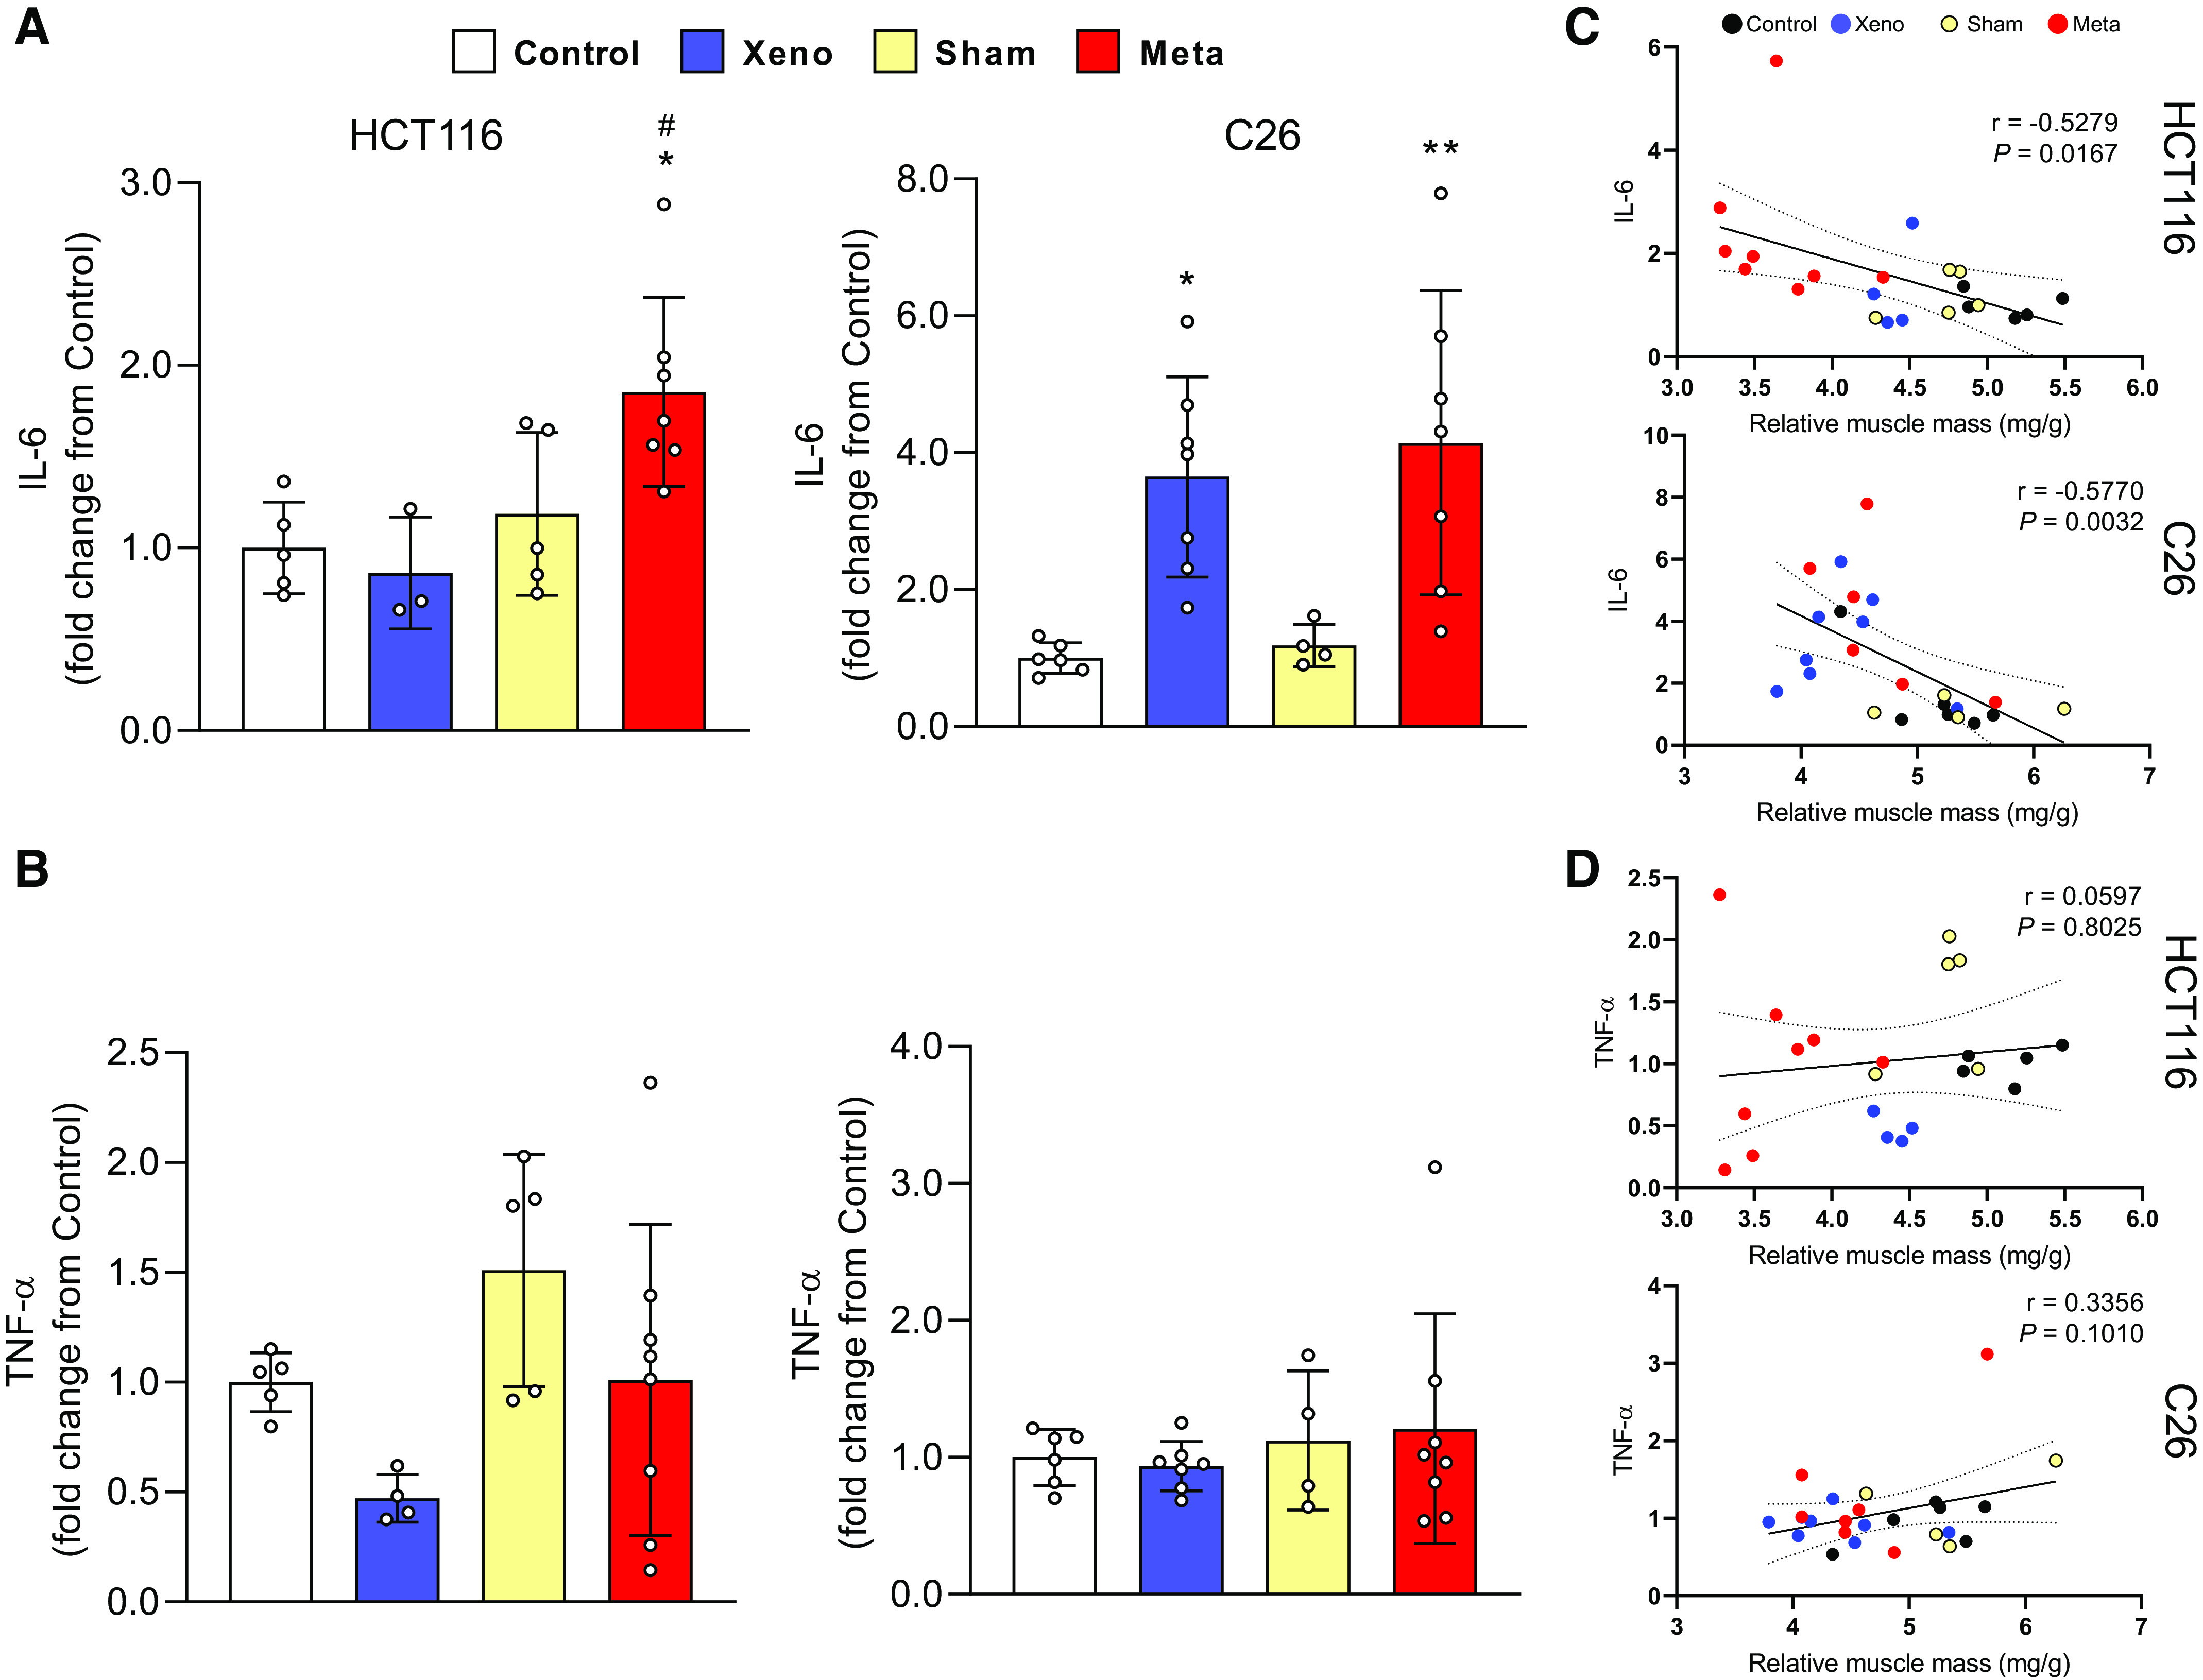
Figure 4.

Local interleukin 6 (IL-6) expression is higher in both mHCT116 and mC26 but not TNF-α. Expression of IL-6 (A) and TNF-α mRNA (B) was analyzed by qPCR. C and D: Pearson product-moment correlations between each factor and muscle mass, respectively. Data are expressed as fold change from controls ± SD. A two-way ANOVA followed by a Tukey’s multiple comparisons test was performed for all direct comparisons between groups. Significant difference from control: *P ≤ 0.05, **P < 0.01; xenograft vs. metastasis: #P < 0.05.
