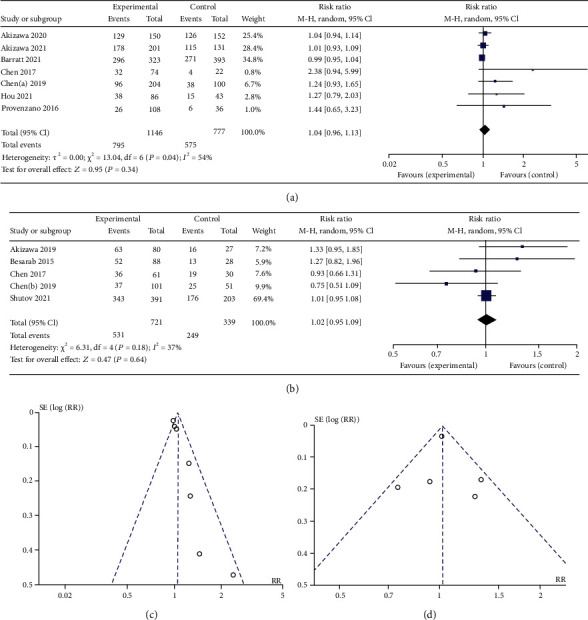
Figure 7.

(a) Forest plot of the risk of the main adverse events in DD study. (b) Forest plot of the risk of the main adverse events in NDD study. (c) Funnel plot of the risk of the main adverse events in DD study. (d) Funnel plot of the risk of the main adverse events in NDD study.
