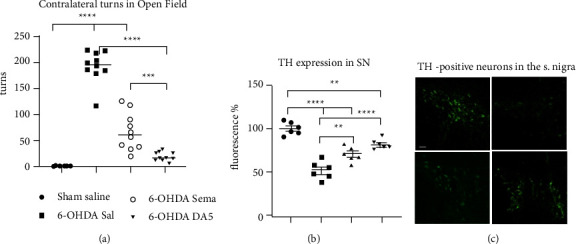
Figure 2.

Apomorphine-induced circling and histology of the SN. Animals received apomorphine i.p. (0.05 mg/kg body weight). After 10 min of injection, the rats were placed in an open-field arena, and their activity was recorded for 30 min. (a) Contralateral turns of apomorphine-induced rotation (means and SEM shown, N = 10 per group; one-way ANOVA followed by Tukey comparisons test). (b) Quantification of TH labeling in the SNpc. The fluorescence of the sham group was set to 100%. ∗∗=p < 0.005; ∗∗∗=p < 0.001; ∗∗∗∗=p < 0.0001. N = 6 per group. (c) Representative fluorescence microscopy images of TH staining in the substantia nigra (scale bar = 50 μm). Top left panel: Sham control; top right panel: 6-OHDA + Sal; lower left panel: 6-OHDA + Sema; lower right panel: 6-OHDA + DA5-CH.
