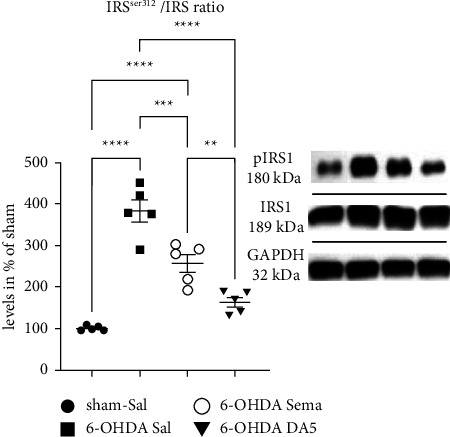
Figure 6.

Effects on 6-OHDA-induced insulin resistance in the substantia nigra. Analysis of the IRS/p-IRS-1ser312 expression ratio in SNpc. The data represent the means ± SEM of 5 rats per group; one-way ANOVA followed by the Tukey multiple comparisons test; ∗∗∗∗=p < 0.0001; ∗∗∗=p < 0.001; ∗=p < 0.05. Western blot samples are shown. Lane 1: Sham; 2: 6-OHDA; 3: 6-OHDA + Sema; 4: 6-OHDA + DA5.
