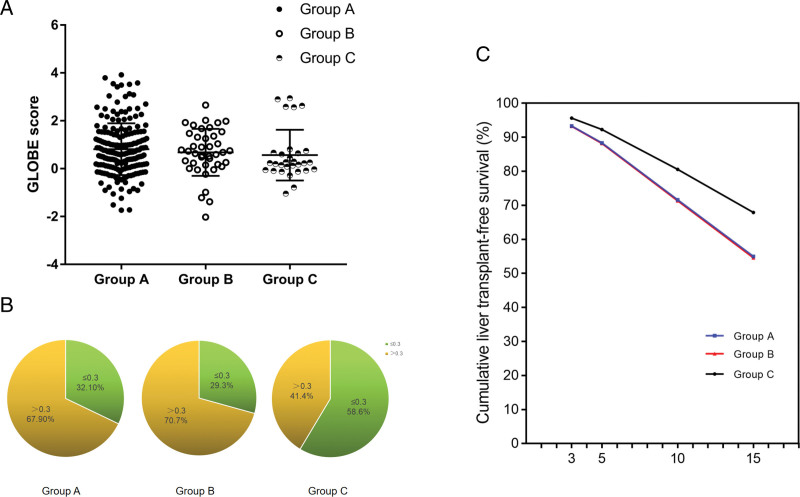
Figure 2.
Survival analysis of the different groups. (A) The GLOBE score of 3 groups, data are expressed as the mean ± SD. (B) Group with GLOBE score >0.3, the proportion of 3 groups. (C) Transplant-free survival curves of different groups. Data are expressed as the IQR. The blue line shows group A, the red line show group B, and the black line show group C. Group A: UDCA monotherapy group; Group B: dual-combination therapy group; Group C: triple-combination therapy group. IQR = interquartile range, SD = standard deviation, UDCA = ursodeoxycholic acid.

