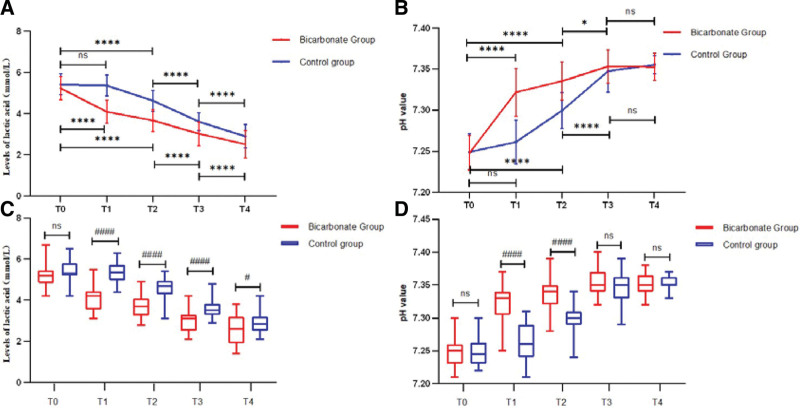
Figure 2.
Levels of lactic acid (A) and pH (B) prior to and following resuscitation by 2-way ANOVA. The levels of lactic acid (C) and pH (D) between the 2 group compared by t test. T0: prior to resuscitation, T1: 1 hr following resuscitation, T2: 3 hr following resuscitation, T3: 24 hr following resuscitation, T4: 72 hr following resuscitation. The Bicarbonate group showed lower lactic acid and higher pH value compared with prior to resuscitation at each time point, however, whether it is lactate or pH, there was no differenceat between the 1 hr following resuscitation and prior to resuscitation. Compared with prior to resuscitation within the group, ****P < .0001, *P < .05; compared with Control group, ####P < .0001, #P < .05. pH = potential of hydrogen.

