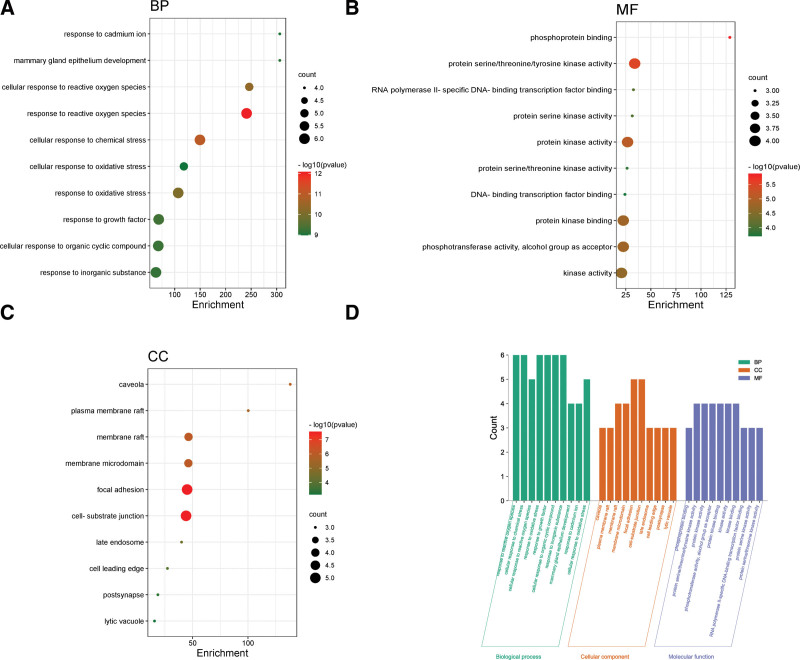
Figure 5.
(A) GO function enrichment analysis bubble diagram. The circle size represents the number of enriched genes; color represents the significance of enrichment. BP = biological process, (B) MF = molecular function, (C) CC = cell component, (D) Histogram of GO enrichment analysis of NR in the treatment of ASD. ASD = autism spectrum disorder, GO = gene ontology.

