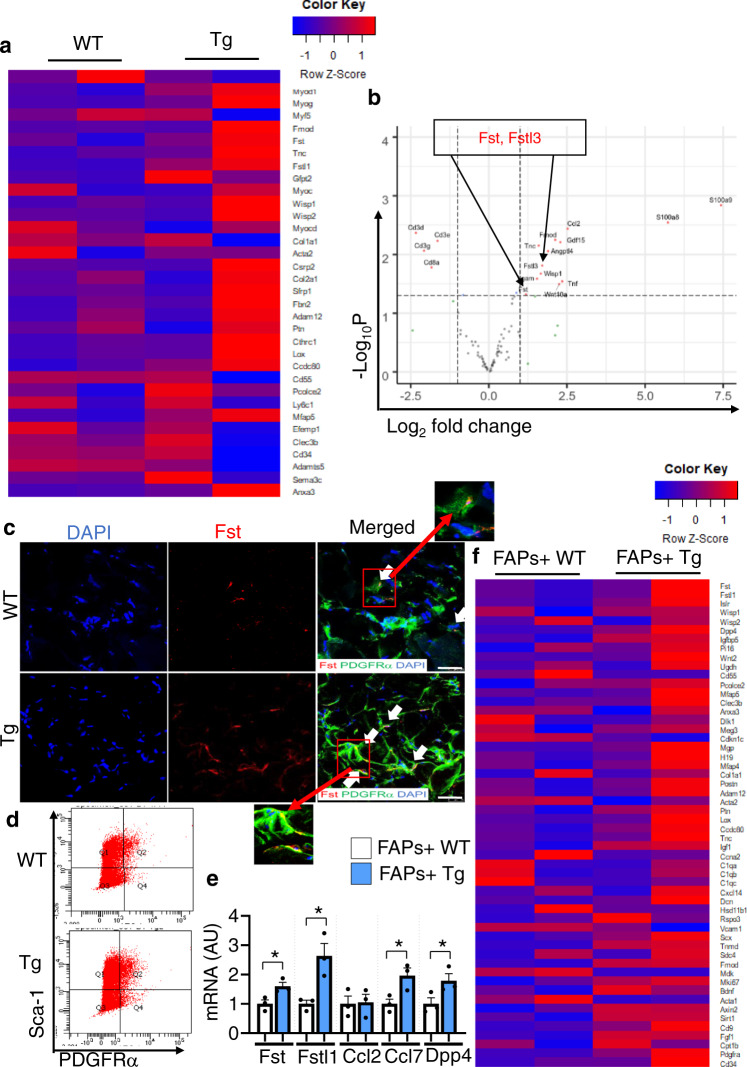
Fig. 2. Depletion of CD206+ M2-like MΦ enhances expression of myogenesis-related marker genes and FAPs-related marker genes.
a Total RNA sequencing (RNA-Seq) analysis of tibialis anterior (TA) of Tg mice and control WT following acute injury. Heatmap of RNA-Seq expression data showing the most significantly altered FAPs-related marker genes in Tg mice, compared with littermate control WT mice (n = 2 mice per group). b Volcano plot analysis highlights the most significant gene alterations in Tg mice versus control WT mice based on false discovery rate threshold (red) [FDR q value < 0.05 and −0.58 > Log2 fold change (FC) > 0.58] and P value threshold (green) [P value < 0.05 and −0.58 > Log2 fold change (FC) > 0.58]. Highlighted in gray are the filtered non-significant changes, as indicated. The red dots represent genes that were significantly upregulated/downregulated in the muscle of Tg mice. The Y-axis denotes the −Log10 P values, while the X-axis shows the Log2 fold change values. The volcano plot was generated using RStudio (n = 2 mice per group). c High resolution confocal imaging of frozen TA sections from Tg mice and WT control mice, stained with anti-PDGFRα and anti-Fst antibodies. Scale bar, 25 μm. Arrows indicate co-localization of PDGFRα and Fst (n = 3 mice per group). Data are representative of at least three independent experiments. d Representative flow cytometry analysis of lineage negative Sca-1/PDGFRα double-positive (FAPs) cells in WT and Tg mice (n = 3 mice per group). Gating strategy is given in Supplementary Fig. 3b. e Relative mRNA expressions of the FACS-isolated FAPs fraction in muscle harvested from WT and Tg mice (n = 3 mice per group). Source data are provided as a Source Data file. The data are shown as the means ± SEM. *p < 0.05, compared with their littermates as determined using the two-tailed Student t-test. f Heatmap representation of differential expression analysis of activated FAPs-related marker genes in isolated FAPs of WT versus Tg mice (n = 2 mice per group).

