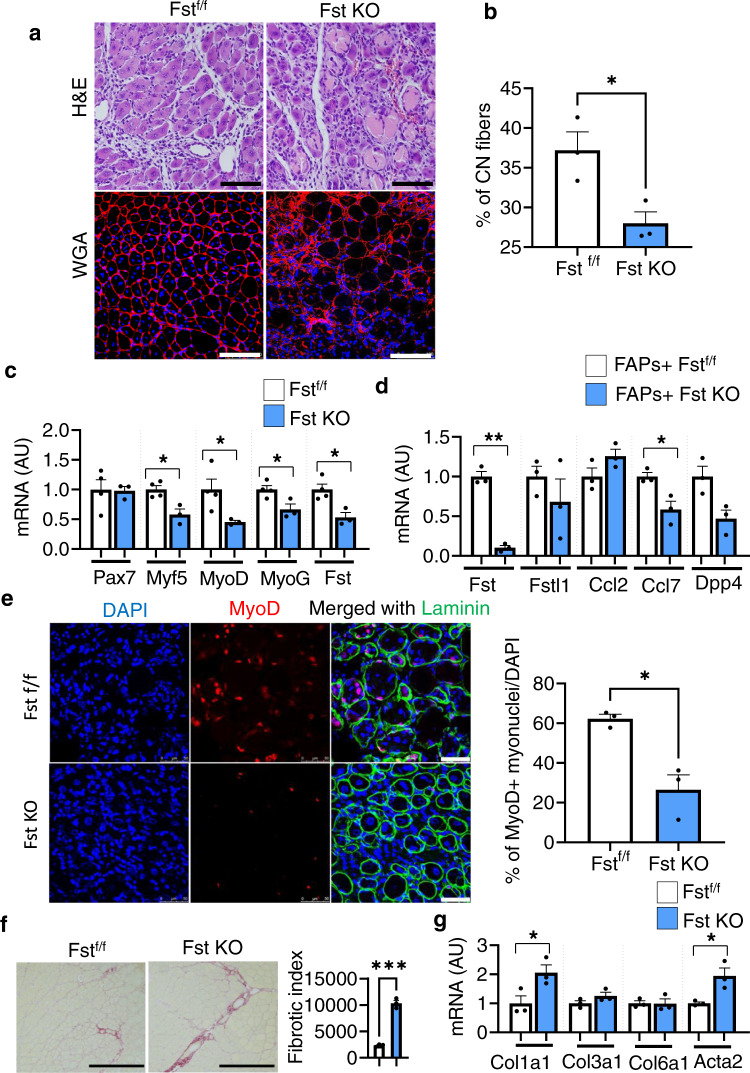
Fig. 3. Depletion of CD206+ M2-like MΦ specifically enhances FAP-derived Fst.
a Histological sections of Gc muscle from FAP-derived Fst KO and Fstf/f control mice, harvested at 7 dpi, stained with H&E (upper) or WGA and DAPI (lower) (n = 3 mice per group). Scale bar, 200 μm (H&E) and 100 μm (WGA). b Images stained with DAPI and WGA were used to quantify centrally nucleated (CN) fibers of muscle from FAP-derived Fst KO and Fstf/f control mice. Quantification of CN myofibers (cross-sectional areas (in µm2) of the Gc muscle) (n = 3 mice per group). c Relative mRNA expression of myogenesis-related marker genes in muscle of FAP-derived Fst KO mice, compared with their littermate controls. n = 4 (Fstf/f), and 3 (Fst KO) mice. d Relative mRNA expression of activated FAP-related marker genes in FACS-isolated FAPs of FAP-derived Fst KO mice, compared with their littermate control Fstf/f mice (n = 3 mice per group). e Representative images of frozen sections of muscle from Fst KO mice and their littermate control Fstf/f mice, stained with anti-laminin, and anti-MyoD antibodies. Scale bar, 50 μm. Quantification is given in right panel (n = 3 mice per group). f Representative images of sirius red-stained sections of TA from tamoxifen-treated FAP-derived Fst KO mice compared to tamoxifen-treated Fstf/f control mice. Quantification is given in right panel (n = 3 mice per group). Scale bars, 200 μm. Fibrotic area (red) was analyzed by ImageJ software. Data are representative of three independent experiments. g Relative mRNA expression of fibrosis-related marker genes in the muscle of Fst KO mice, compared with their littermate controls (n = 3 mice per group). Source data are provided as a Source Data file. The data are shown as the means ± SEM. *p < 0.05, **p < 0.01, and ***p < 0.001 were considered significant as determined using the two-tailed Student t-test. Fst follistatin, f/f flox/flox, and KO knockout.

