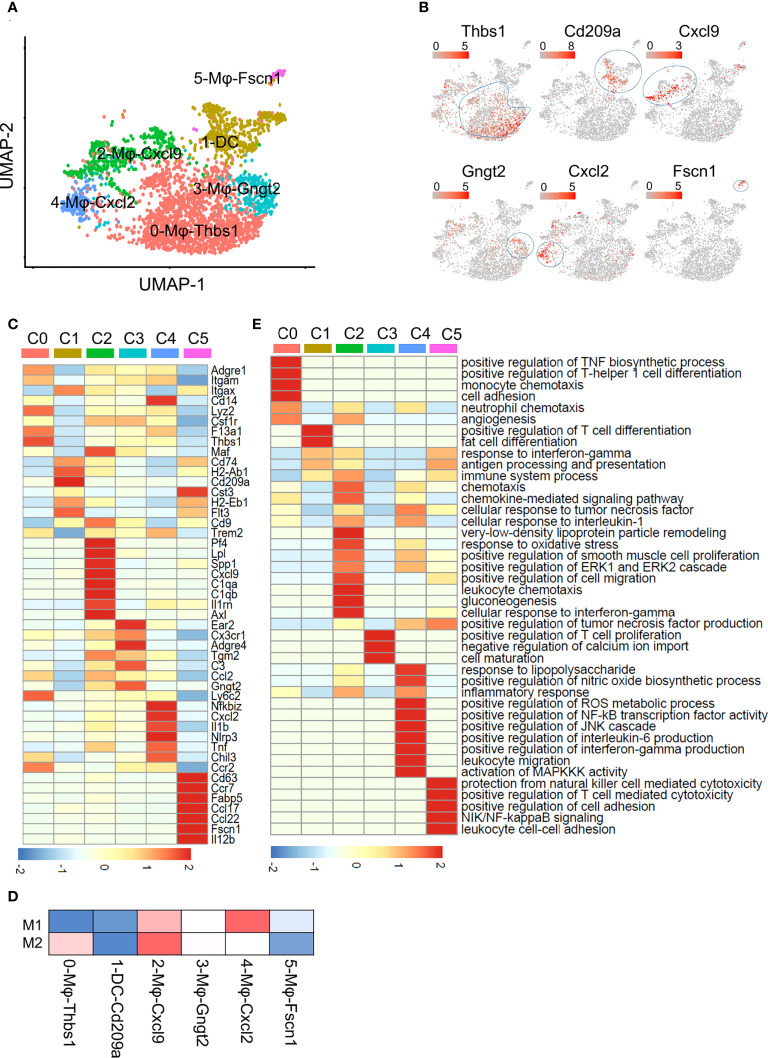
Figure 2.
Subclustering of macrophages and DCs. (A) UMAP plot of liver macrophages and DCs showing a six-cluster distribution. (B) Feature plots of marker gene expression in six clusters. (C) Heatmap showing the marker genes of each cluster mentioned in (A). (D) Gene enrichment for classical cell type M1 and M2 in comparisons with the macrophage and DCs subsets in NAFL. (E) GO BP terms enriched in the indicated subset. The gene list is the marker genes of each cluster, colored by -log10 (P value), scaled by row.

