Figure 4.
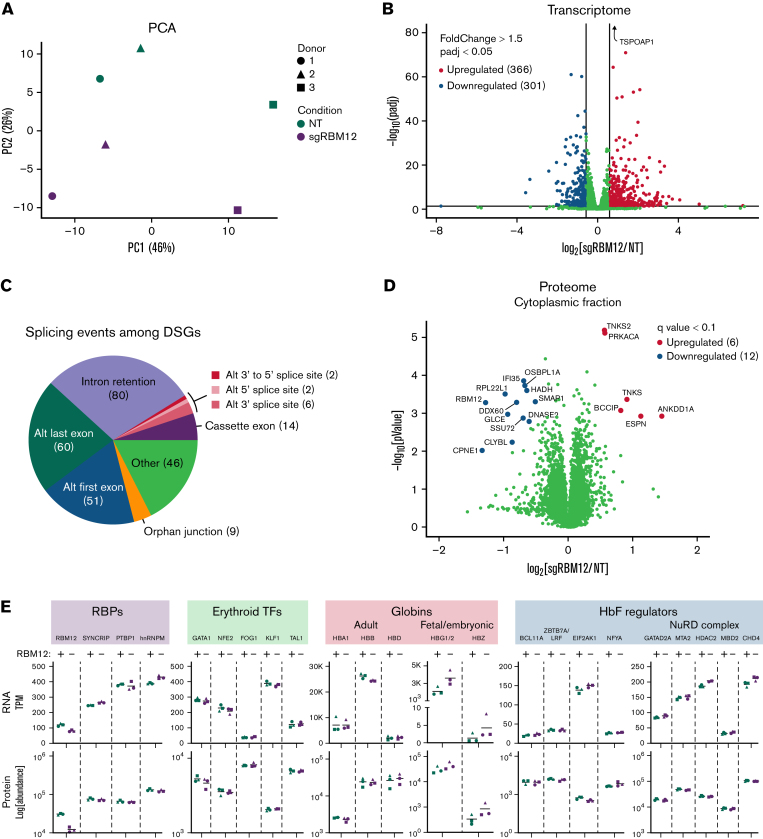
Effects of RBM12 depletion on transcriptome and proteome. (A) PCA of normalized read counts from RBM12-knockout (KO) RNA-seq in primary human erythroblasts at day 7 of differentiation. (B) Volcano plot of differentially expressed transcripts. Highlighted are transcripts found to be differentially expressed with a fold change ≥1.5 and adjusted P < 0.05. (C) Pie chart displaying abundance of alternative splicing events occurring among differentially spliced genes (DSGs). (D) Volcano plot of the cytoplasmic fraction of RBM12-KO liquid chromatography/tandem mass spectrometry in primary human erythroblasts at day 7 of differentiation. Highlighted and labeled are proteins found to be differentially expressed with a q-value <0.1. (E) Transcripts per million (TPM; top) and fold change protein abundance (bottom) of RBM12 KO vs NT control samples (n = 3 independent donors).

