Figure 5.
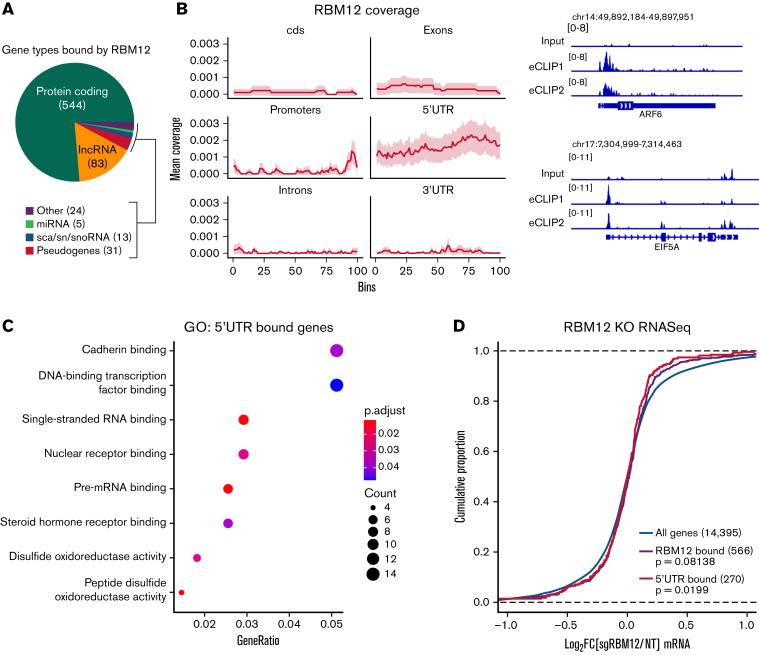
RBM12 binding patterns. RBM12 eCLIP-seq in WT primary human erythroblasts at day 8 of differentiation. (A) Pie chart displaying the distribution of gene types bound by RBM12. (B) Left: Coverage profile of RBM12 binding. Each feature was divided into 100 bins of equal length. Right: Representative Integrative Genomics Viewer snapshots of RBM12-bound genes. Displayed are the size-matched input control and 2 replicate eCLIP tracks. (C) Gene Ontology (GO) analysis of transcripts bound at the 5′UTR by RBM12. (D) Empirical cumulative distribution function plot displaying log2 fold change in transcript abundance of RBM12 KO samples over control along with RBM12 bound peaks (in general and specifically at 5′UTR). P values calculated by Kolmogorov-Smirnoff test.

