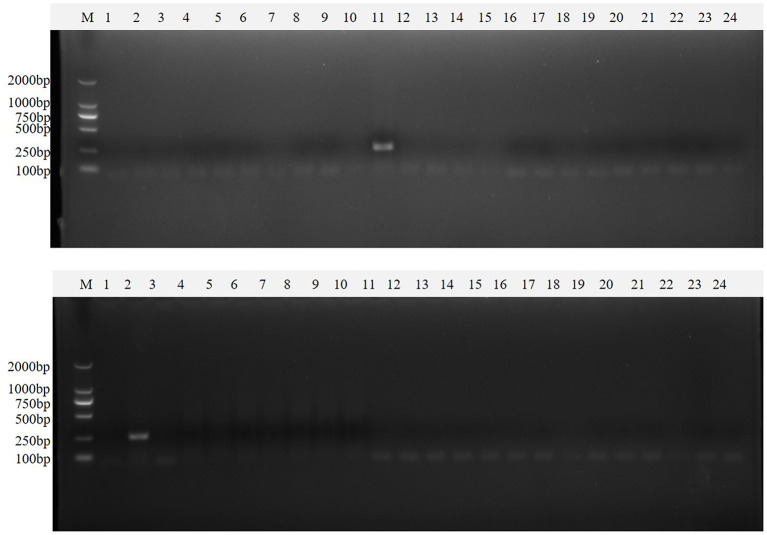
Figure 10.
Single PT-PCR was used to verify the results of clinical samples. PDCoV (A–C) 1–24, PDCoV (A–C) 25–48, PDCoV (D–F) 1–24, and PDCoV (D–F) 25–46 represent agarose gel electrophoresis patterns of single RT-PCR recheck results of clinical samples tested for PDCoV; PEDV (A–C) 1–24, PEDV (A–C) 25–48, PEDV (D–F) 1–24 and PEDV (D–F) 25–46 represent agarose gel electrophoresis patterns of single RT-PCR recheck results of clinical samples tested for PEDV; SADS-CoV (A–C) 1–24, SADS-CoV (A–C) 25–48, SADS-CoV (D–F) 1–24 and SADS-CoV (D–F) 25–46 represent agarose gel electrophoresis patterns of single RT-PCR recheck results of clinical samples tested for SADS-CoV; TGEV (A–C) 1–24, TGEV (A–C) 25–48, TGEV (D–F) 1–24 and TGEV (D–F) 25–46 represent agarose gel electrophoresis patterns of single RT-PCR recheck results of clinical samples tested for TGEV.

