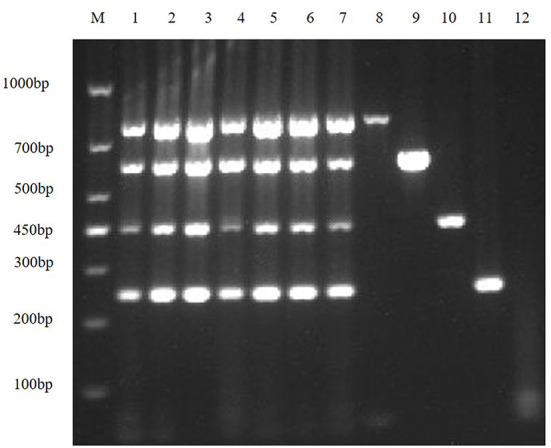
Figure 2.

Optimize multiplex RT-PCR annealing temperature. This figure shows the optimization results of multiplex RT-PCR annealing temperature, lane M is DNA Marker DL1000, lanes 1–7 represent 7 temperature gradients of 53, 54, 55, 56, 57, 58, 59 °C; lanes 8–11 are the positive controls for TGEV, PEDV, SADS-CoV and PDCoV, respectively; lane 12 is the negative control.
