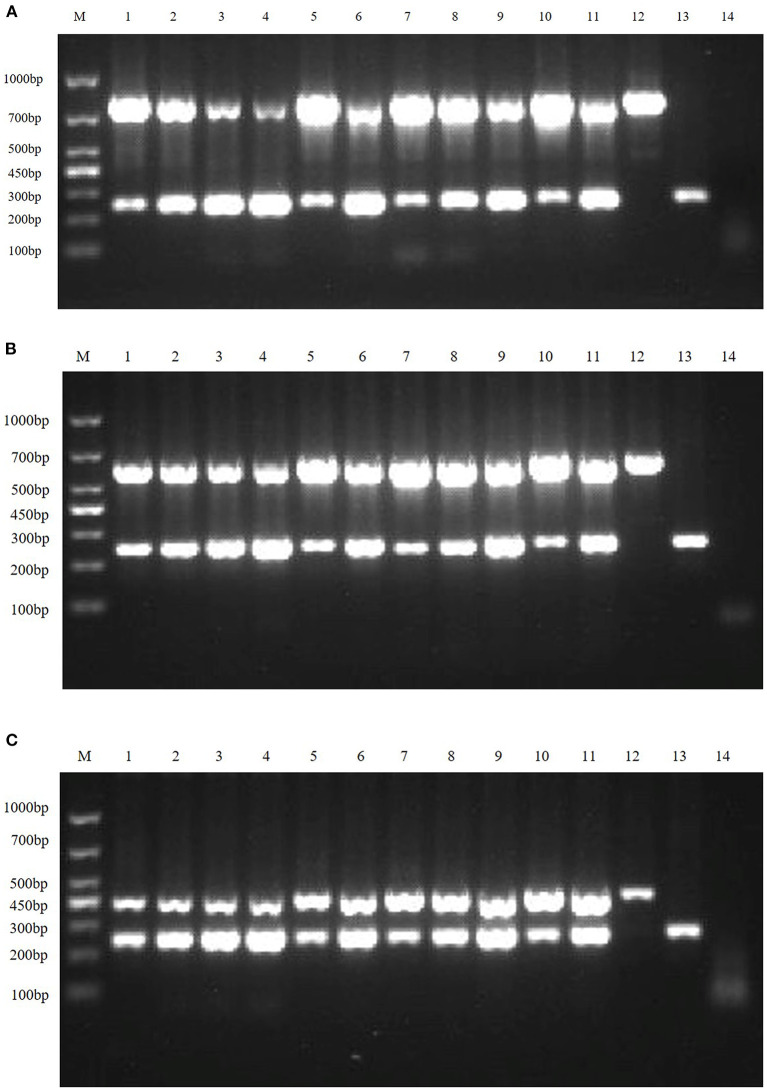
Figure 4.
Multiplex RT-PCR primers optimization. (A) is the electrophoresis results of TGEV and PDCoV duplex RT-PCR with different primer ratios; lane M is DNA Marker DL1000; Lanes 1–11 are the primer ratios of 1: 1, 1: 2, 1: 3, 1: 4, 2: 1, 2: 3, 3: 1, 3: 2, 3: 4, 4: 1, 4: 3; Lanes 12–13 are the positive controls for TGEV and PDCoV; and lane 14 is the negative control. (B) The electrophoresis results of PEDV and PDCoV duplex RT-PCR with different primer ratios; lane M is DNA Marker DL1000; Lanes 1–11 are the primer ratios of 1: 1, 1: 2, 1: 3, 1: 4, 2: 1, 2: 3, 3: 1, 3: 2, 3: 4, 4: 1, 4: 3; Lanes 12–13 are the positive controls for PEDV and PDCoV; and lane 14 is the negative control. (C) The electrophoresis results of SADS-CoV and PDCoV duplex RT-PCR with different primer ratios; lane M is DNA Marker DL1000; Lanes 1–11 are the primer ratios of 1: 1, 1: 2, 1: 3, 1: 4, 2: 1, 2: 3, 3: 1, 3: 2, 3: 4, 4: 1, 4: 3; Lanes 12–13 are the positive controls for PEDV and PDCoV; and lane 14 is the negative control.

