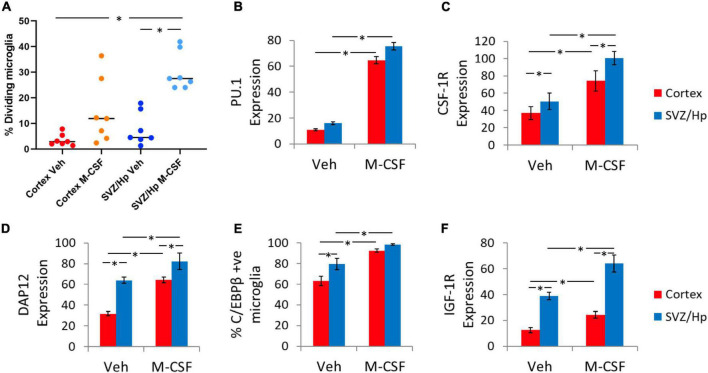
FIGURE 2.
Basal and Macrophage Colony-Stimulating Factor (M-CSF)-induced microglial proliferation and expression of PU.1, CSF-1R, DAP12, CEBPβ, and IGF1 receptor. (A) Quantification of the percentage of microglia that incorporate BrdU under control conditions and with M-CSF treatment showing a significant increase in microglial division with M-CSF and an enhanced response in ventricular/Hp microglia. Each data point indicates an individual case (n = 7). (B) M-CSF significantly increases the intensity (arbitrary fluorescence units) of PU.1 expression (amount of PU.1 protein) in adult human microglia from neurogenic (ventricular/Hp) and non-neurogenic (cortical) regions of the adult human brain. (C) CSF-1R is more highly expressed in ventricular/Hp microglia than cortical microglia. A significant increase in intensity of receptor labelling is found for CSF-1R following M-CSF treatment. (D) Quantification of DAP12 staining intensity shows a significantly greater level of expression in ventricular/Hp microglia compared to cortical microglia, and a significant increase in DAP12 expression with M-CSF treatment. (E) Quantification of microglial C/EBPβ expression showing differential basal expression by cortical and ventricular/Hp microglia, and significant increases in the percentage of cortical and ventricular/Hp microglia which express C/EBPβ following M-CSF treatment. (F) Ventricular/Hp microglia express significantly more IGF-1R than cortical microglia, and a significant increase in intensity of IGF-1R is evident following M-CSF treatment. (B–F) Protein expression was quantified using an intensity threshold in Metamorph image analysis software, as described in the methods. *indicates P value < 0.05.

