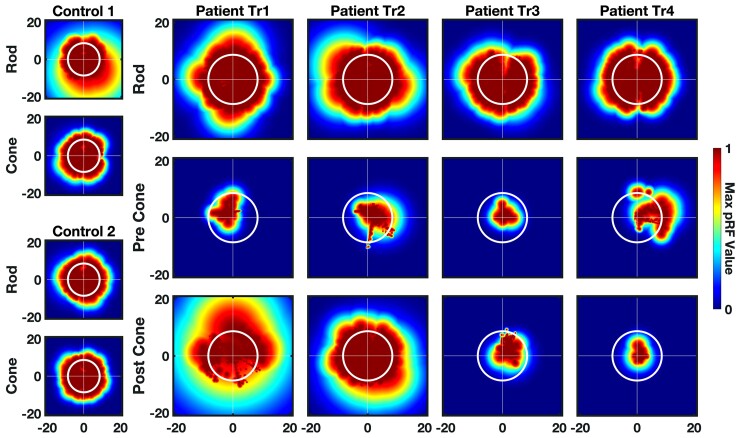
Figure 3.
Cortical visual field coverage. Visual field coverage for V1–3 computed using the maximum pRF density for each participant across both hemispheres. Left: Visual field coverage of two representative normal-sighted controls (Controls 1 and 2) for rod and cone maps. Right: Coverage plots for rod map (pre-treatment) and cone map (pre- and post-treatment) for Patients Tr1–4. Colour indicates maximum value of pRF density. White circle indicates the maximum aperture of the stimuli (8.6°). Post-treatment cone-mediated visual field coverage encompasses the whole stimulated visual field for Patient Tr2 and is densest in the upper visual field for Patient Tr1.

