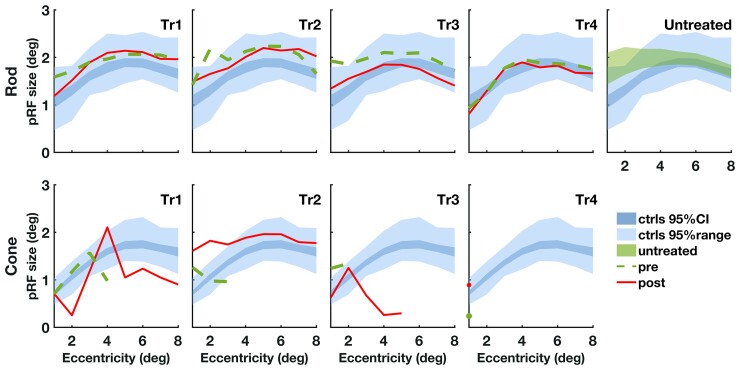
Figure 4.
pRF size by eccentricity. Median pRF size for V1–3 across both hemispheres for each participant plotted against 1 degree eccentricity bins (range: 0.5–8.5). Bins with few data points were excluded (fewer than 10% of pRFs included in the equivalent bin in the non-selective condition). For each condition (rod, top row; cone, bottom row) the 95% CI (dark blue) and 95% range (light blue) of the normal-sighted control group (n = 26) are plotted. The 95% CI (green) of all 13 untreated patients with ACHM (top right) reveals ∼1 larger pRF size estimates compared to normal-sighted for small eccentricities. Pre-treatment data (dashed green line) and post-treatment data (solid red line) are plotted for treated Patients Tr1–4. There is no change in the rod-selective condition after treatment. In the cone-selective condition, pRF size can only be measured across the entire eccentricity range after treatment, which reveals small deviations compared to normal sighted for Patients Tr1 and Tr2 but no consistent increase or decrease across both patients. ecc = eccentricity; deg = degrees; pre = pre-treatment; post = post-treatment; ctrls = controls; CI = confidence interval.

