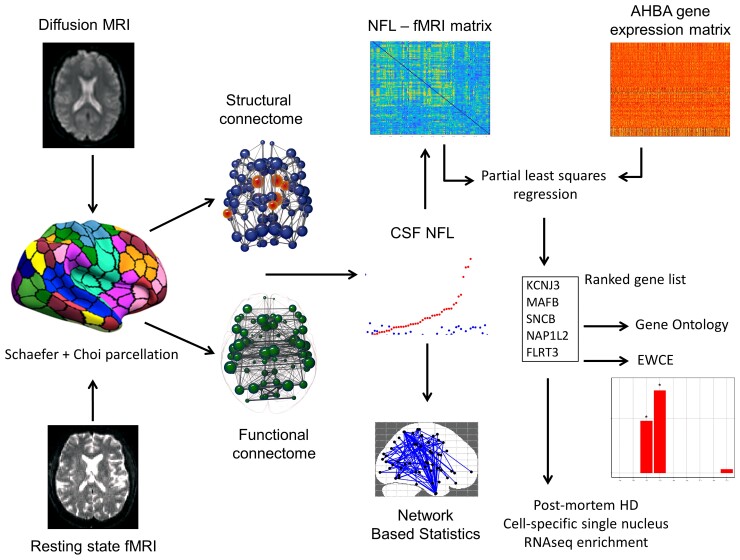
Figure 1.
Summary of analysis pipeline. Diffusion MRI and resting-state fMRI underwent preprocessing and were parcellated using the Shaefer cortical atlas38 and the Choi subcortical atlas.39 Structural and functional connectomes were then created based on weighted streamlines between brain regions and temporal fMRI time-series correlations between regions, respectively. Correlations were performed between CSF NfL and brain networks using NBS. An NfL–fMRI correlation matrix was also used to investigate associations with regional gene expression using the AHBA. PLS regression produced a ranked gene list of those genes most strongly associated with NfL–fMRI hyperconnectivity. GO and EWCE were then used to investigate biological and cell-specific associations. Finally these results were validated using snRNAseq72 from post-mortem Huntington’s disease (HD) and control brains.

