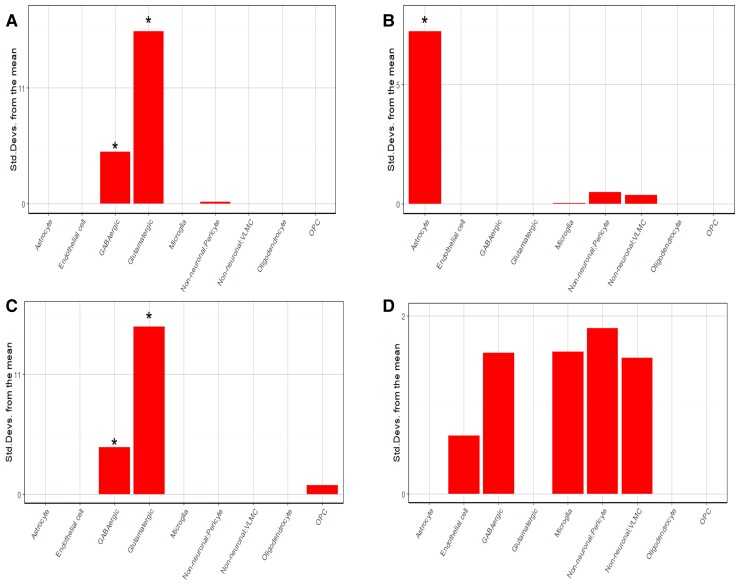
Figure 3.
EWCE analysis using AHBA 2019 cell-specific gene annotation. (A) Top 10% upweighted genes for the partial correlation analysis. (B) Top 10% downweighted genes for the partial correlation analysis. (C) Top 10% downweighted genes for the Group × NfL analysis. (D) Top 10% upweighted genes for the Group × NfL analysis. *Corrected significance. OPC = oligodendrocyte precursor cells; VLMC = vascular leptomeningeal cells.

