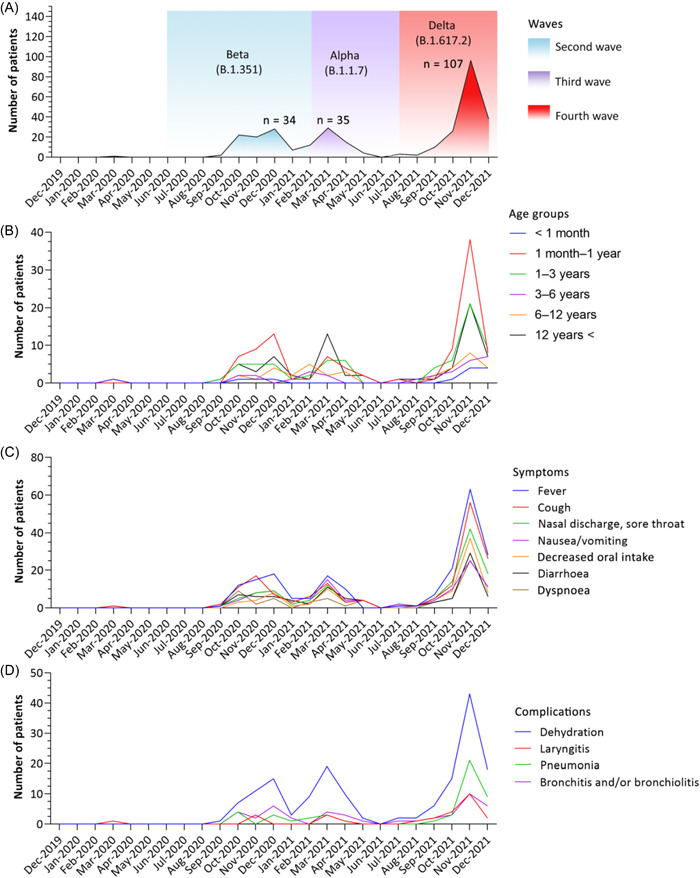
Figure 1.

Time series data. (A) Patient number distribution over timer (the highest number of patients in a given wave is denoted by n; colors represent the period of each wave based on Hungarian database 6 ; first wave was not present due to the low patient number), (B) age distribution of hospitalized patients over time, (C) dominating symptoms in coronavirus disease 2019 (COVID‐19) patients over time, (D) complications in COVID‐19 patients over time.
