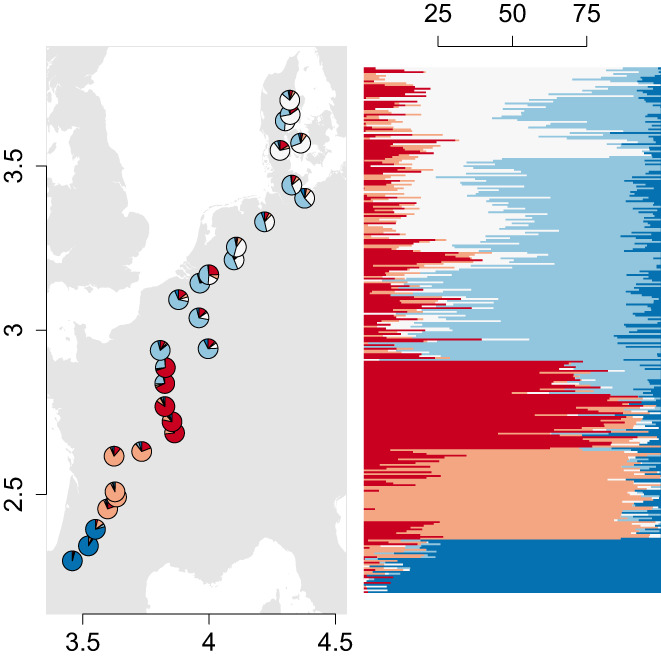
FIGURE 2.

A geographic representation of Primula elatior population admixture proportions (left) and individual ancestry coefficients (right) along the range (from southern France up to north Denmark). The longitudinal and latitudinal scale of the distribution range in Europe (left) is indicated in meters × 106 (Coordinate system: LAEA89). The admixture proportions are illustrated as percentages for each individual (N = 285).
