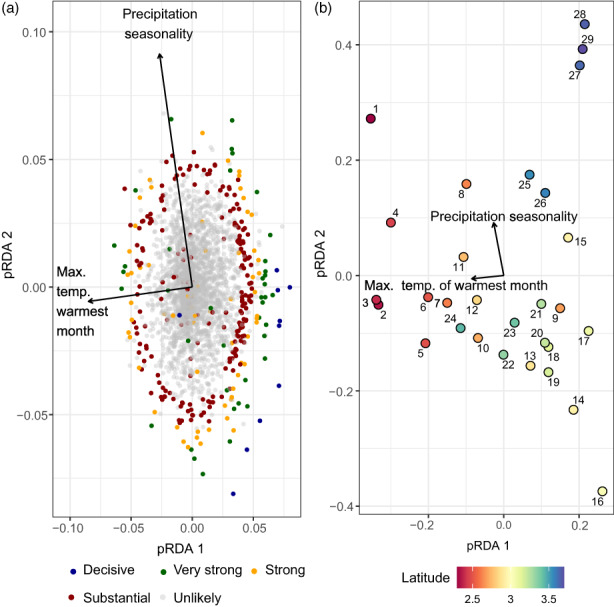
FIGURE 3.

The partial redundancy analysis (pRDA) biplot in panel a illustrates the pRDA scores of the first two axes with Primula elatior single nucleotide polymorphisms (SNPs) as response variables, climate as fixed explanatory variables and isolation by resistance (IBR) moran eigenvector maps as conditional explanatory variables. Decisive outliers had <1% false discovery rate (FDR), very strong outliers <5% FDR, strong outliers <10% FDR and substantial outliers <25% FDR. Only decisive and very strong outliers were used for further analysis. The pRDA biplot in panel b displays the pRDA scores of the sampled population sites along the distribution range in Europe. Numbers indicate the plot ID from south (low) to north (high). The latitude colour scheme indicates the latitude in metres × 106 (Coordinate system LAEA89). The statistical evaluation of the pRDA model (Climate | IBR) can be found in Table 1.
