
FIGURE 5.
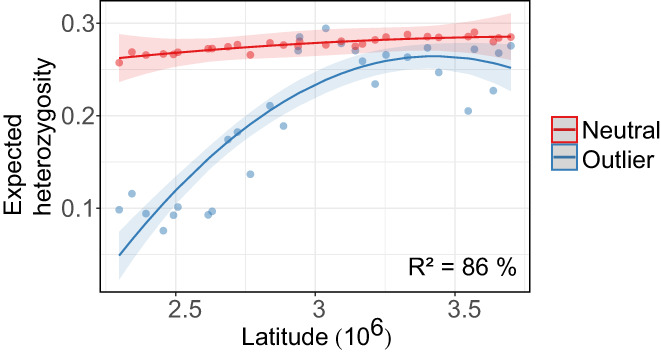
Expected heterozygosity (H e) of Primula elatior across the latitudinal distribution range. H e is illustrated for climate outliers (blue), identified using RDA while partialling out the effect of isolation by resistance moran eigenvector maps, and neutral SNPs (red). The distinction in the model fit between outlier H e and neutral H e was addressed by an interaction effect of a binary outlier term with latitude and quadratic latitude respectively: H e ~ Latitude × outlier + Latitude2 × outlier.