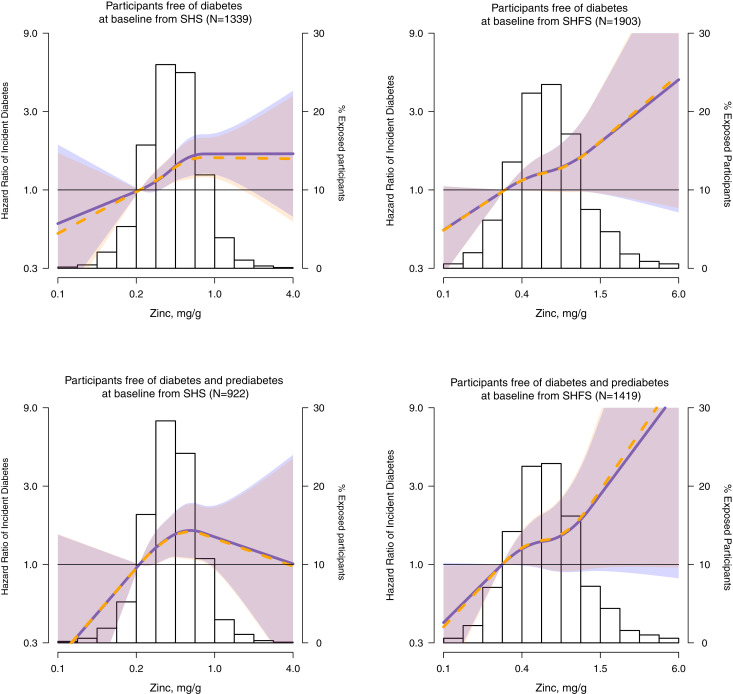
Figure 2.
Hazard ratios of incident diabetes by urinary zinc levels (mg/g) in participants free of diabetes at baseline in the SHS (N = 1,339) and in the SHFS (N = 1,903) and participants free of diabetes and pre-diabetes at baseline in the SHS (N = 922) and in the SHFS (N = 1,419). Lines with shaded areas represent the hazard ratios (95% CI) of incident diabetes, based on restricted quadratic splines for hazard regression models (SHS) and cubic splines for mixed effects hazard regression models (SHFS) for log-transformed zinc distribution with knots at the 10th, 50th, and 90th percentiles (0.26, 0.47, and 0.82 mg/g in the SHS and 0.29, 0.60, and 1.32 mg/g in the SHFS, respectively, in participants free of diabetes at baseline, 0.26, 0.46, and 0.78 mg/g in the SHS and 0.28, 0.58, and 1.30 mg/g in the SHFS in participants free of diabetes and prediabetes at baseline). The reference value was set at the 10th percentile of zinc distribution. Blue lines (blue-shaded areas) represent the estimated hazard ratios in models stratified by study region and adjusted for sex, baseline education (<12 years, ≥12 years), smoking status (never, former, and current), BMI (kg/m2), and eGFR (mL/min/1.73 m2). Orange lines (orange-shaded areas) represent the estimated hazard ratios in the same model used previously but adjusted by HOMA-IR score. The histogram represents the frequency distribution of zinc in the study sample. The extreme tail of the histograms in the SHS is truncated because 2 participants among 1,339 participants free of diabetes at baseline and one participant among 922 free of diabetes and prediabetes at baseline had levels higher than 4 mg/g. The extreme tails in the SHFS are truncated because 8 participants in both populations (free of diabetes at baseline and free of diabetes and pre-diabetes at baseline) presented lower levels than 0.1 mg/g and 3 among them had levels higher than 6 mg/g.

