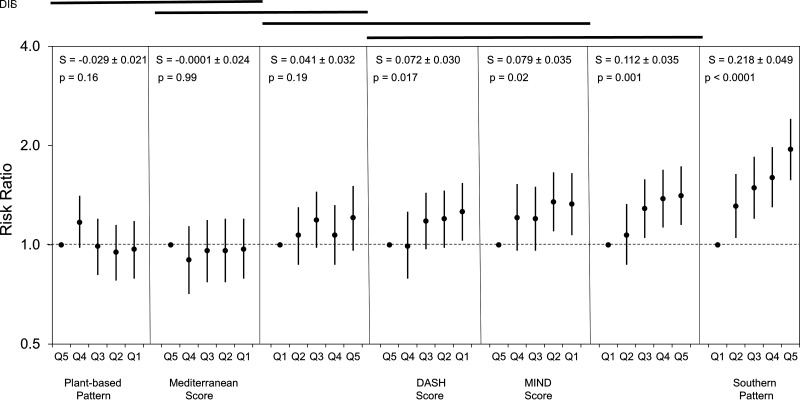
Figure 2.
Association of dietary scores and incident type 2 diabetes with adjustment for demographic and lifestyle factors. Model 2 presented here includes adjustment for TEI; demographics of age, race, sex, region, income, and education; and lifestyle factors of smoking, physical activity, and alcohol. RR for incident type 2 diabetes as a function of quintile (ordered from the quintile with the lowest expected risk of incident type 2 diabetes to the quintile with the highest expected risk of incident type 2 diabetes), where dietary measures have been ordered by the slope of increase of the RR (S ±SE). RRs are plotted on logarithmic scale for clarity of interpretation. P values in each panel are for the significance of the trend test for a relationship of the dietary measure with risk of incident type 2 diabetes. The lines at the top of the graph are over dietary measures where the differences in slope are not significant different (i.e., for any pair of dietary measures, the two measures are significantly different at P < 0.05 if there is not a line connecting the two measures).

