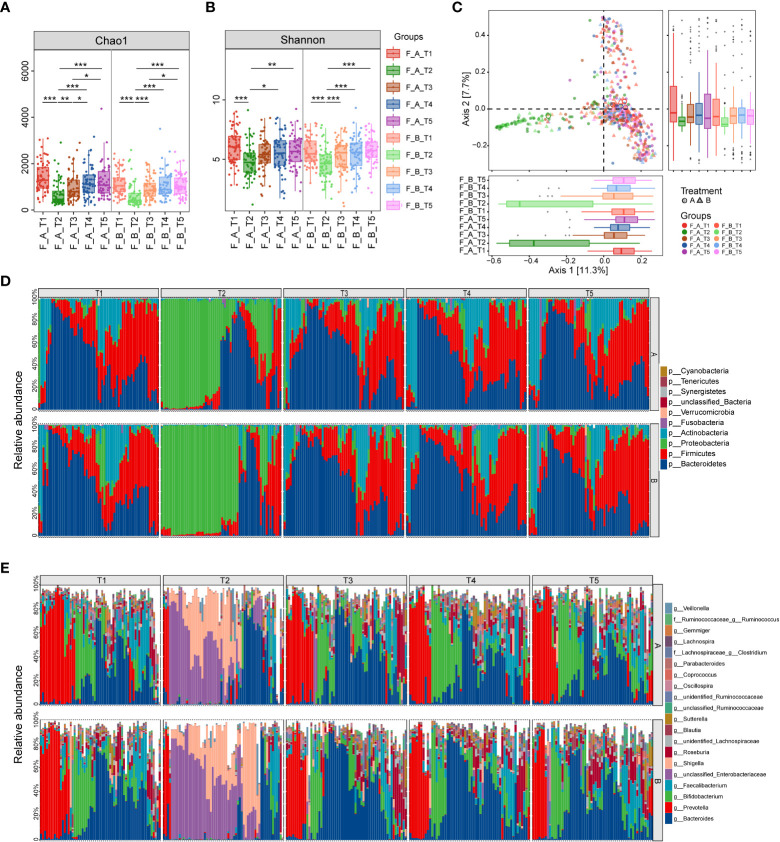
Figure 2.
Comparison of diversity and composition of gut microbiota after eradication therapy. (A, B) Alpha diversity, representing the richness of microbiota, was significantly reduced immediately following eradication treatment (T2) and then gradually returned to baseline from T3 to T5. (C) Principal coordinate analysis (PCoA) based on Bray-Curtis distances revealed the overall microbiota composition differed between T2 and other time points. (D) Relative proportions of the top 10 bacterial phyla. (E) Relative proportions of the top 20 bacterial genera. A, probiotics group; B, placebo group; T1, pretreatment; T2, cessation of quadruple therapy; T3, 2 weeks after quadruple therapy; T4, 8 weeks after quadruple therapy; T5, 24 weeks after quadruple therapy; *, p<0.05; **, p<0.01, ***, p<0.001.

