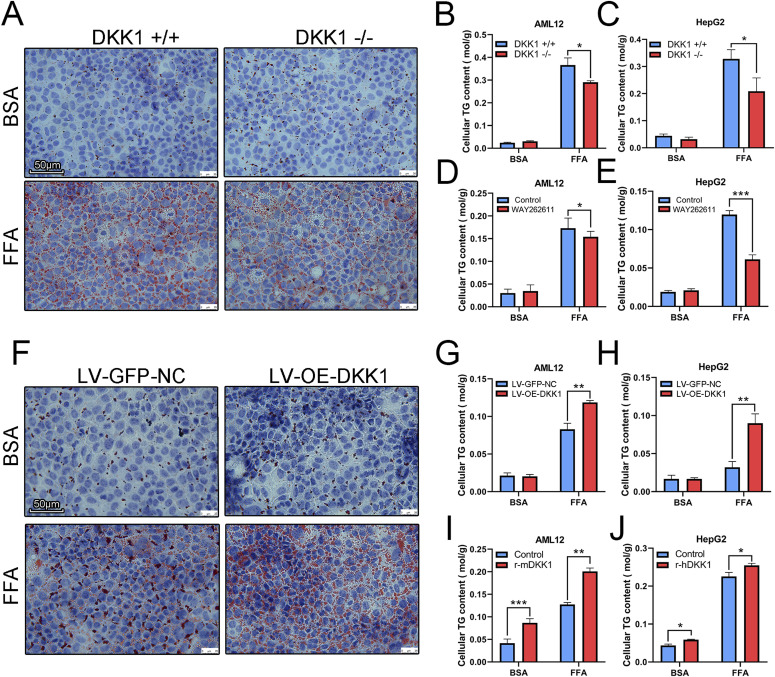
Figure 3. Manipulations of DKK1 expression confirmed the linkage of DKK1 and steatosis in cell lines.
(A, B, C) Under DKK1 knockout conditions, cell steatosis was induced by FFA (A, B, C), n = 3 in each group. (A, B, C) Oil red O staining (A) scale bar = 50 µm; TG measurements in DKK1−/− AML12 (B) and DKK1−/− HepG2 (C) cells. n = 3 in each group. (D, E) The changed TG was further confirmed with administration of a DKK1 inhibitor, WAY262611 in AML12 (D) and HepG2 (E) cells. n = 3 in each group. (F, G, H) On other hand, under DKK1 overexpression condition, the induced steatosis status was parallel analyzed, oil red O staining (F), and TG measurements in DKK1−/− AML12 (G) and DKK1−/− HepG2 (H) cells. n = 3 in each group. (I, J) Furthermore, the changed trend of TG was further confirmed with administration of recombinant DKK1 protein in AML12 (I) and HepG2 (J) cells. n = 3 in each group. *P < 0.05, **P < 0.01, ***P < 0.001 as compared with the indicated controls by two-tailed t tests. All data are shown as the means ± SD.
Source data are available for this figure.

