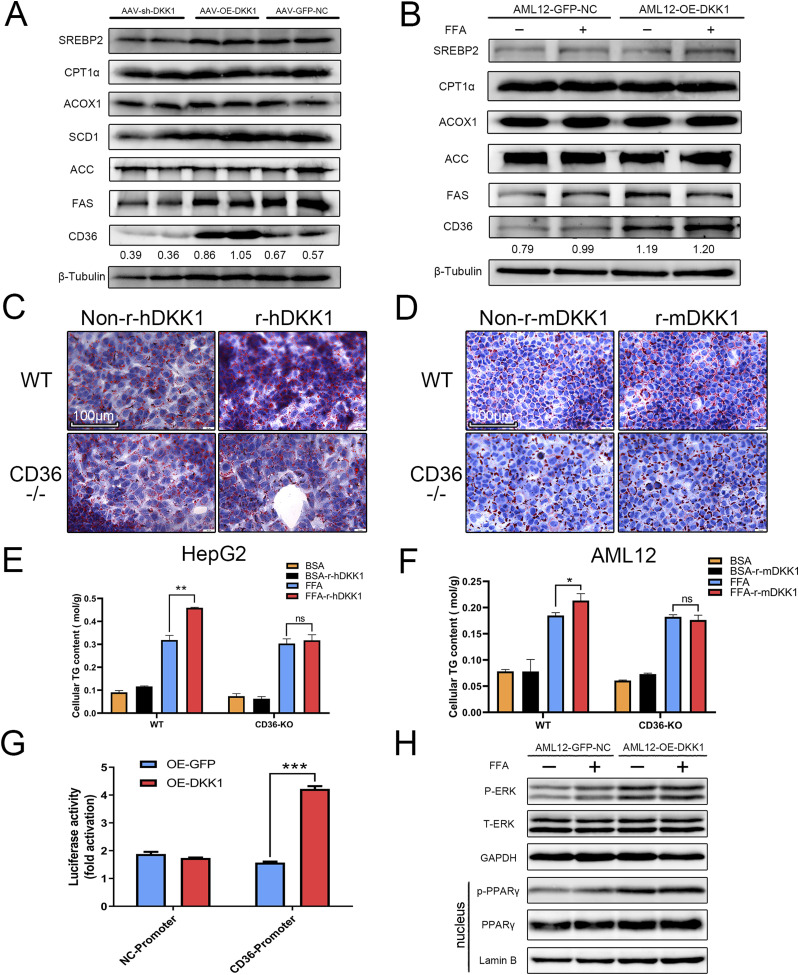
Figure 5. CD36 is a key mediator of DKK1-driven steatosis.
(A, B) Representative Western blot analyses of lipid metabolism–related proteins in DKK1 overexpression- or knock-down mice (A) and DKK1 overexpression in AML12 cell line (B), in which the numbers marked above the controls were the ratio between CD36 compared with the β-Tubulin. (C, D, E, F) The ORO staining of WT and CD36−/− cells cultured with recombinant DKK1 protein (r-hDKK1 or r-mDKK1) with or without FFA induction (C, D) scale bar = 100 µm, and measurement of TG contents in CD36−/− HepG2 (E) and CD36−/− AML12 (F) cells. n = 3 in each group. (G) The CD36-promoter-driven luciferase reporter assay under DKK1 overexpression condition. n = 3 in each group. (H) Western blot analysis shows the overexpression of DKK1 increased pERK and nucleus PPARγ in AML12 cells with independent duplicates. *P < 0.05, **P < 0.01, ***P < 0.001 as compared with the indicated controls by two-tailed t tests. All data are shown as the means ± SD.
Source data are available for this figure.

