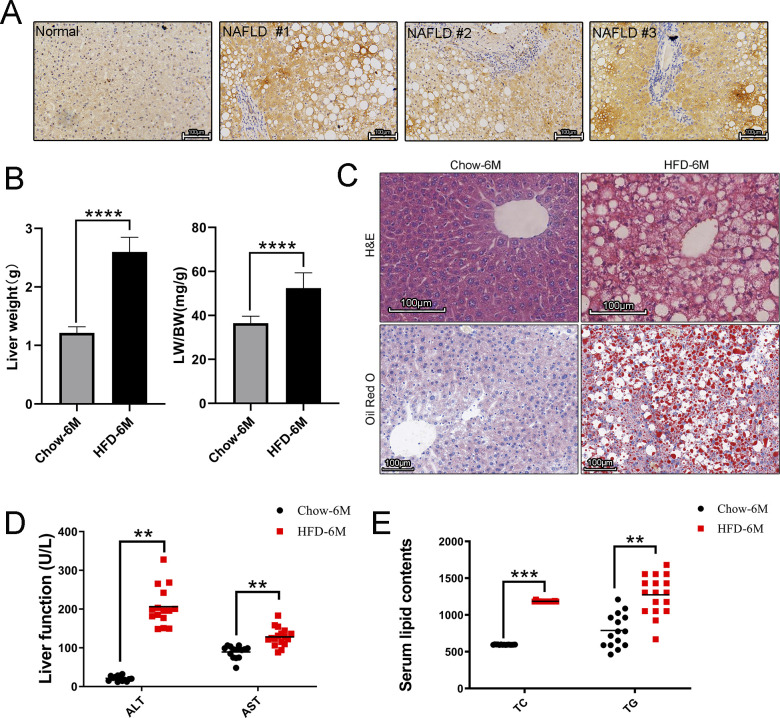
Figure S1. Characterization of HFD-induced NAFLD mice.
(A) Represented images of DKK1 immunohistochemistry staining on liver sections from NAFLD patients (n = 5) and normal controls (n = 3); scale bar = 100 µm. (B) LW and LW/BW index of chow- and HFD-fed 6-mo mice (n = 5). (C) Lipid accumulations in the livers were analyzed by H&E staining and ORO staining (n = 3); scale bar = 100 µm. (D, E) Serum ALT, AST; (E) serum lipids measurement (n = 14–17). **P < 0.01, ***P < 0.001, ****P < 0.0001 as compared with the indicated controls by two-tailed t tests. All data are shown as the means ± SD.
Source data are available for this figure.

