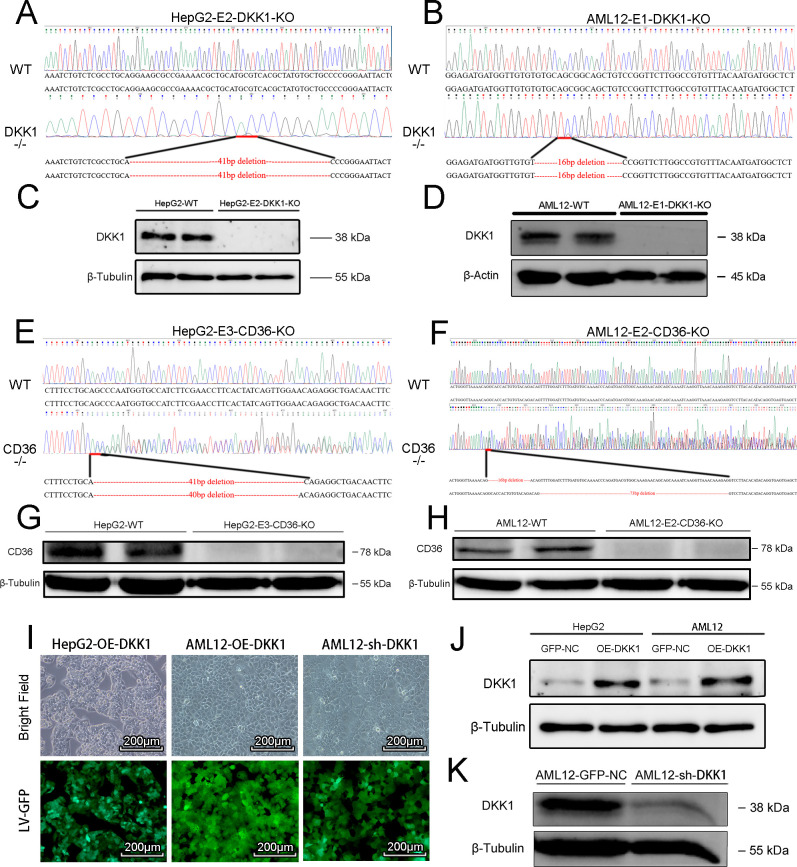
Figure S2. Generation and confirmation of gain and loss DKK1 function cell lines.
(A, B, C, D, E, F, G, H) The targeted locus of DKK1 and sequencing analysis of homozygous knockout HepG2 and AML12 (A, B) cells that were confirmed with Western blot (C, D), and the paralleled experiments performed on CD36 knockout cells (E, F, G, H). (I, J, K) The DKK1-overexpressed (OE-DKK1) or DKK1-knock-down cell lines (sh-DKK1) were constructed by transfecting overexpression lentivirus or shRNA lentivirus, respectively. Scale bar = 200 µm (I), and the DKK1 levels were confirmed by Western blot analysis (J, K).
Source data are available for this figure.

