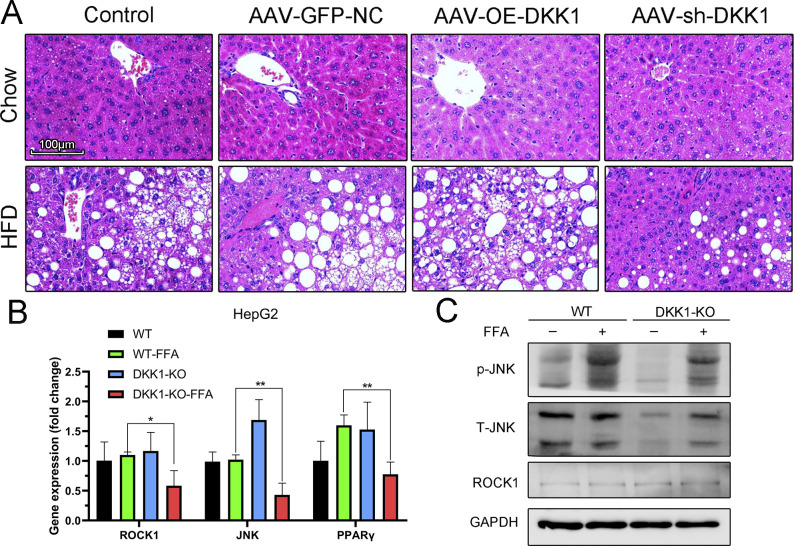
Figure S3. Liver histochemical analysis for different manipulations of DKK1 expression and expression analyses of key genes in non-classical Wnt signaling of DKK1-KO HepG2 cells.
(A) H&E staining of livers from controls and different DKK1 gene manipulations with 20 wk chow or HFD fed; scale bar = 100 µm. (B) mRNA levels of Wnt-related genes in WT and DKK1-KO HepG2 cells treated with FFA or BSA for 24 h (n = 3). (C) Representative Western blot of ROCK1, total and phosphorylated JNK in WT, and DKK1-KO HepG2 cells treated with FFA or BSA for 24 h (N = 2). *P < 0.05, **P < 0.01 as compared with the indicated controls by two-tailed t tests. All data are shown as the means ± SD.
Source data are available for this figure.

