Figure 2.

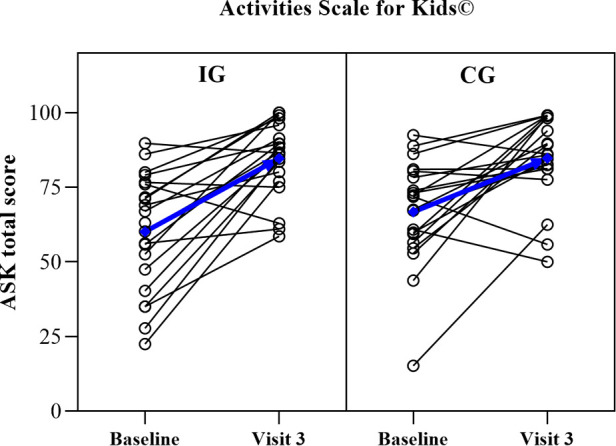
Within-participant development from the baseline (Visit 0) to Visit 3 for the activities scale for Kids© total score in the intervention (IG, n = 20) and control group (CG, n = 20). Blue lines represent within-group mean development.

Within-participant development from the baseline (Visit 0) to Visit 3 for the activities scale for Kids© total score in the intervention (IG, n = 20) and control group (CG, n = 20). Blue lines represent within-group mean development.