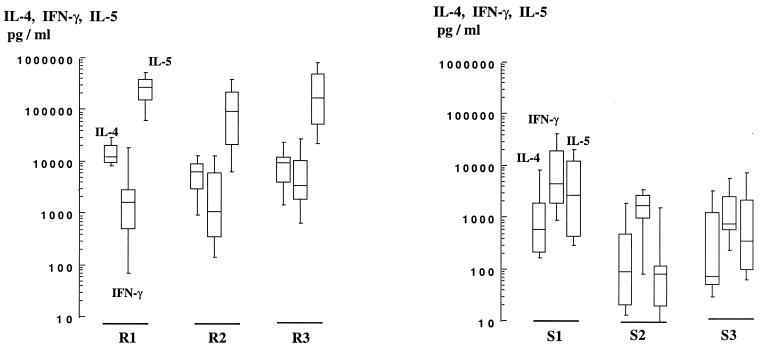
FIG. 1.
Production of IL-4, IL-5, and IFN-γ by parasite-specific CD4+ TCC from resistant (left) and susceptible (right) individuals. Boxes represent the 25th to 75th centiles, and vertical bars represent the 10th to the 90th centiles of the mean of one or two duplicate determinations performed on culture supernatants of each TCC stimulated by anti-CD3 plus PMA. Horizontal lines are the median values. The numbers of clones were 7, 11, 7, 13, 11, and 9 for subjects R1, R2, R3, S1, S2, and S3, respectively.

