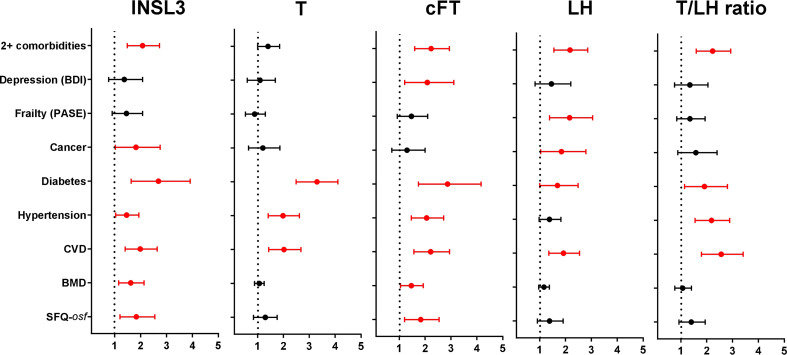
Figure 4.
Odds Ratios (OR; mean and 95% confidence intervals) calculated from multivariate binomial logistic regressions of the indicated binomial categorical variables representing different morbidities from phase 2, as indicated on the Y axis, against various hormonal parameters from phase 1 as independent predictors, here represented as binomial categorical variables. INSL3, T, cFT, and T/LH ratio: lowest quartiles vs remainder; LH: highest quartile vs remainder. Significant OR are indicated in red; non-significant relationships are excluded (not shown). BMD and SFQ-osf are expressed as binomial categorical variables, as in the legend to Figure 2 .

