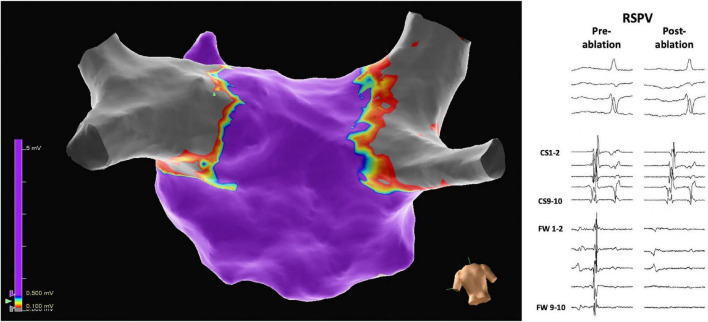
FIGURE 2.
Three-dimensional electrophysiological voltage maps after pulmonary vein isolation were performed with pulsed field ablation. On the right, pre-and post-ablation electrograms demonstrate the isolation of, in this case, the right superior pulmonary vein (RSPV). The scale of the electrograms shown is 100 mm/sec.

