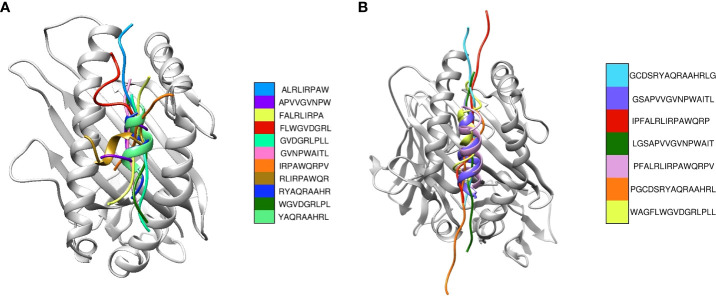
Figure 2.
Superimposition of the most suitable epitopes. (A) The CD8+ epitopes are superimposed, with each colour representing a different model. The respective HLA structures are shown in grey (B) The CD4+ epitopes are superimposed, with each colour representing a different model. The HLA structure is shown in grey.

