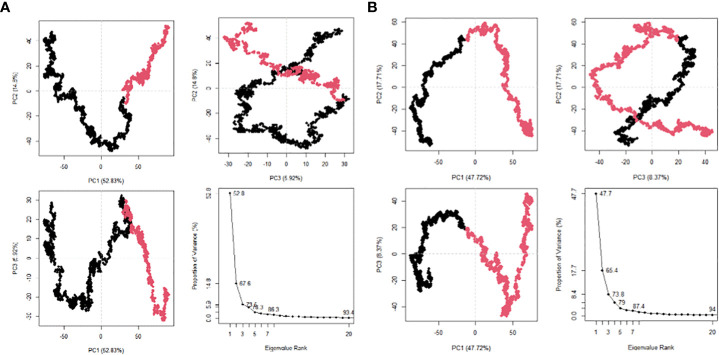
Figure 8.
Post MDS analysis of the MEV constructs. (A) The PCA plots for MEV one in eigenvalue rank; PC2 vs PC1, PC2 vs PC3, PC3 vs PC1. The colours are based on order of time and the cumulative variability at each data point. (B) The PCA plots for MEV two in eigenvalue rank; PC2 vs PC1, PC2 vs PC3, PC3 vs PC1. The colours are based on order of time and the cumulative variability at each data point.

