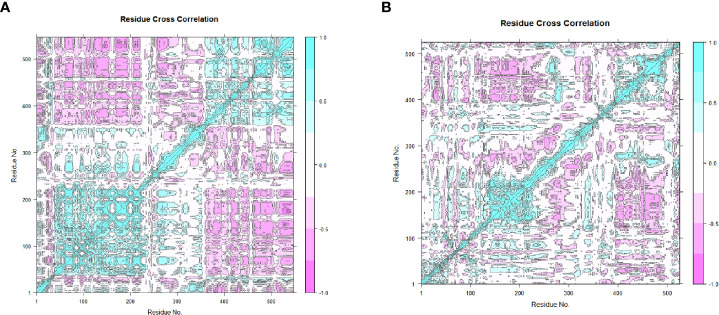
Figure 9.
The dynamical cross-correlation maps generated based on the MEVs. The blue regions indicate the residues moving in a singular direction, while the pink regions indicate that the residues moved in opposite directions. (A) The dynamical cross-correlation map generated based on MEV one. (B) The dynamical cross-correlation map generated based on MEV two.

