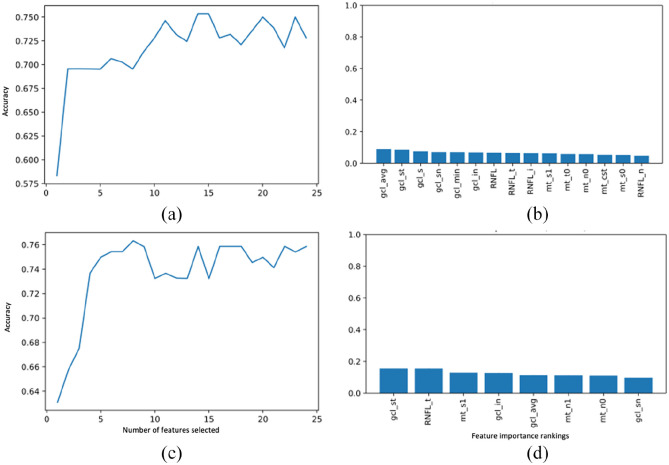
Figure 5.
Feature importance plots per recursive feature elimination wrapped around the Random Forest classifier in identifying demyelinating diseases (a-b) and multiple sclerosis (c-d). (Right) Plot showing the number of OCT features required for input to achieve the highest accuracy; and (Left) Feature importance ranking of the best set of input features.

