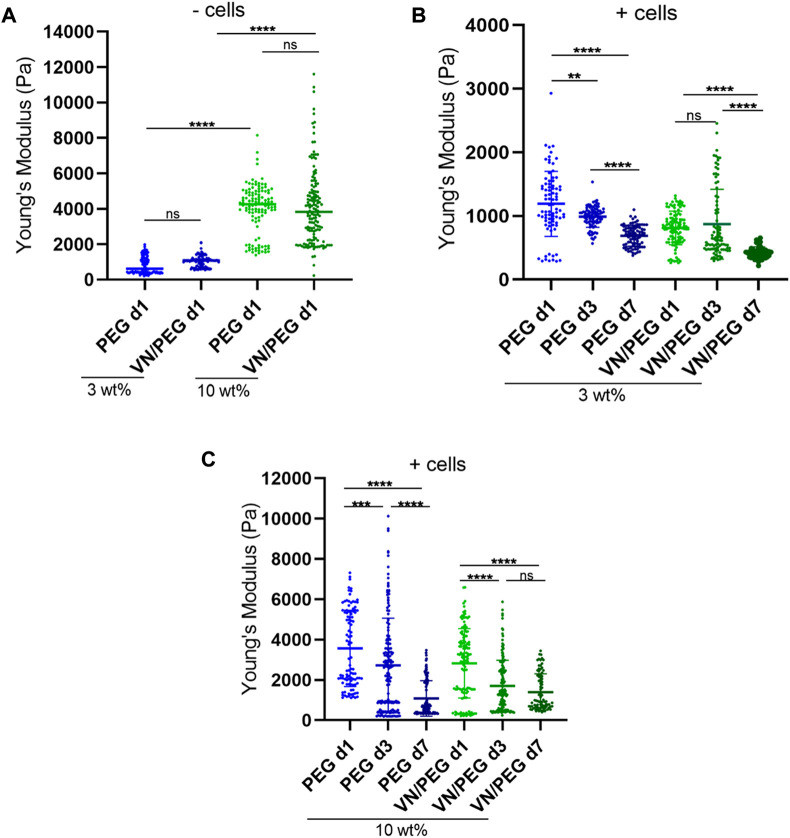
FIGURE 3.
3D VN hydrogel with tunable stiffness. (A). Comparison between 3 and 10 wt% PEG gel stiffness with/without VN measured using nanoindentation. (B,C). In situ stiffness measurements of 3 (B) and 10 wt% (C) SK-N-BE (2)-loaded hydrogels at 1, 3, and 7 days. A minimum of three maps per replicate were measured and at least two replicates per sample were tested. ANOVA test was used for statistical analyzes.

