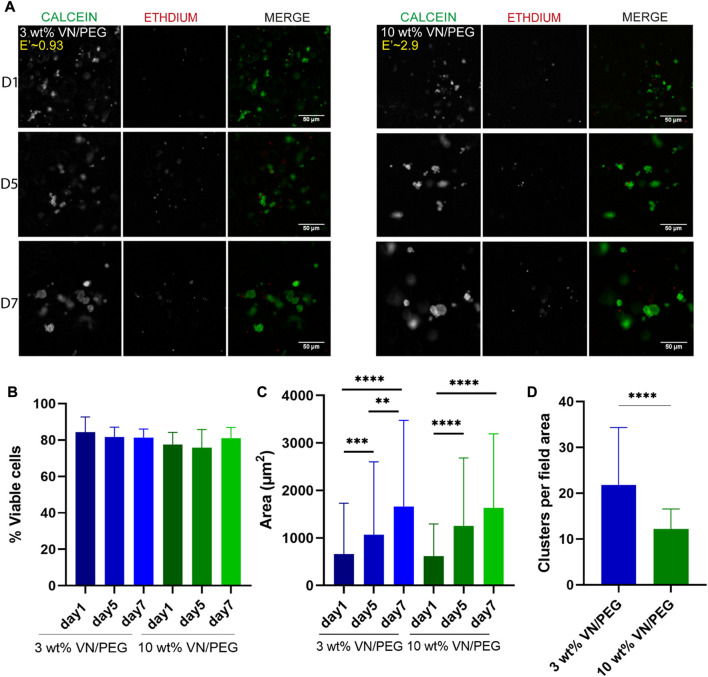
FIGURE 4.
Cell viability in 3D VN based hydrogels. (A). Images of calcein-AM (green) and ethidium homodimer-1 (red) for SK-N-BE (2) in 3 and 10 wt% VN/PEG with 500 μg ml−1 of VN. (B). Quantification of SK-N-BE (2) viability with ANOVA statistical method. (C). Cell cluster area for 3 and 10 wt% VN/PEG hydrogels after 1, 5, and 7 days (scale bar 50 µm). Statistical differences were analyzed by Kruskal–Wallis test. (D). Mean number of clusters per field area for 3 and 10 wt% VN/PEG hydrogels, grouping images from 1, 5 and 7 days together. Mann-Whitney analysis was performed to compare the number of clusters. A total of 15 images (3 replicates, 5 images each) were taken per sample condition.

