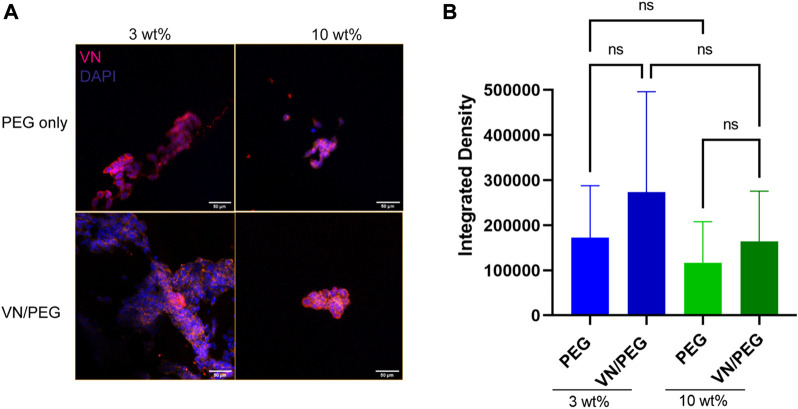
FIGURE 5.
Distribution of VN secreted by the cells in 3D PEG and VN/PEG hydrogels. Immunofluorescence images of SK-N-BE (2) cultured for 7 days in 3 and 10 wt% PEG and VN/PEG. Images show nuclei (blue) and VN (magenta) (scale bar 50 µm). (B). Immunofluorescence quantification of VN secreted by cells in 3 and 10 wt% PEG with/without VN. We have represented in the graph the Integrated density (total raw intensity per image normalized by cell area). A total of 15 images (3 replicates, 5 images each) were taken per sample condition.

