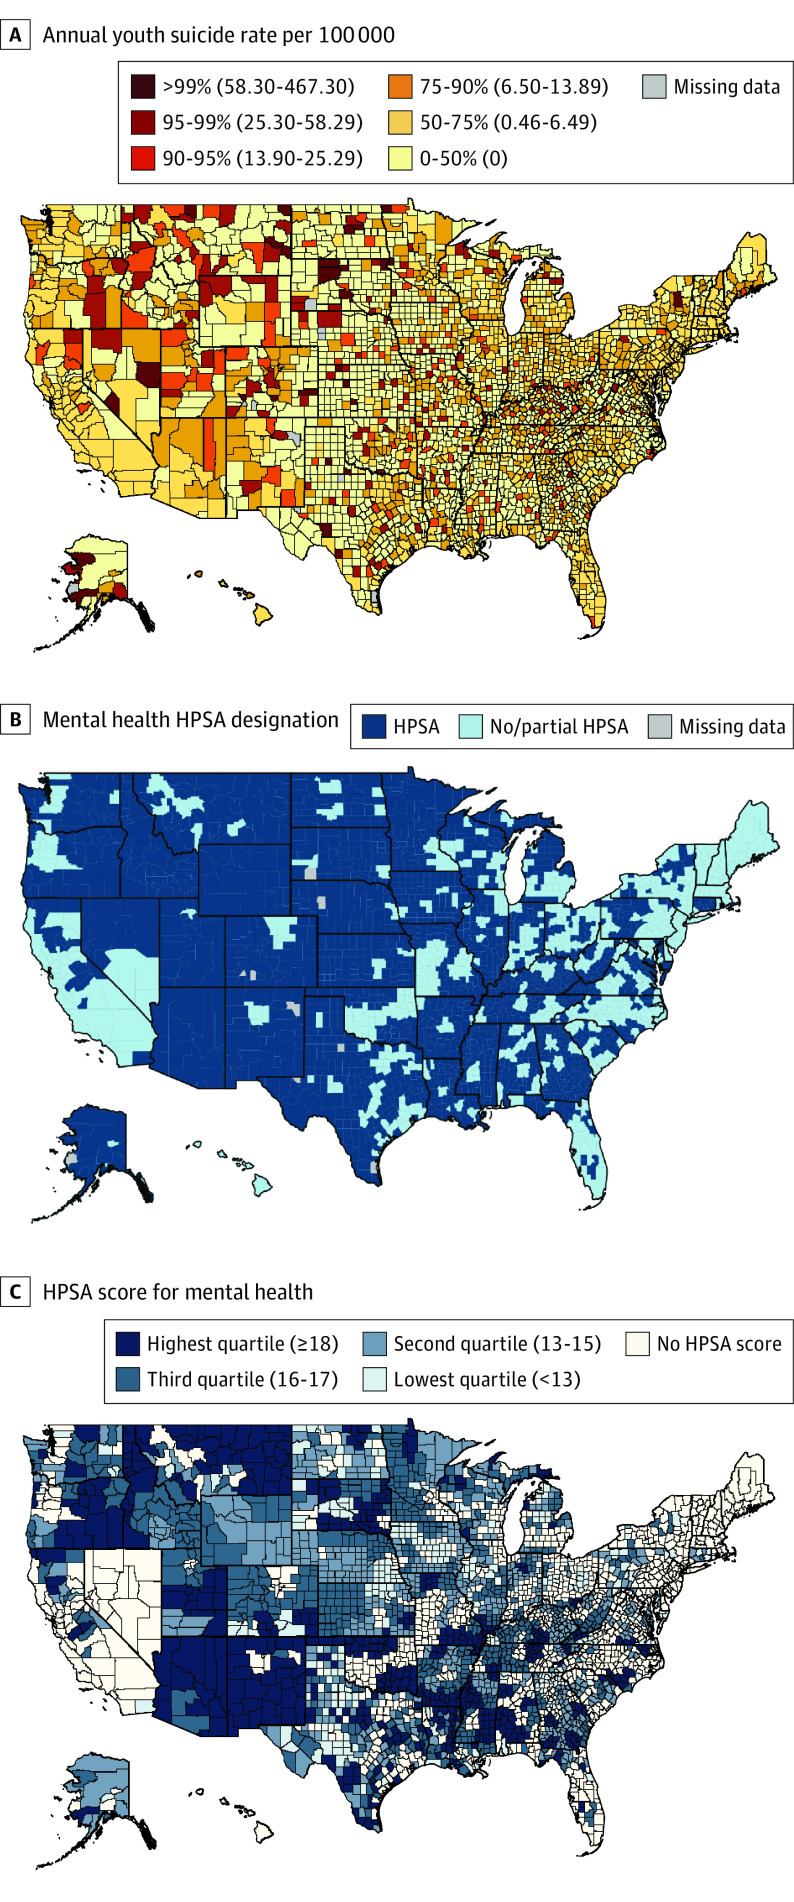
Figure 1. US County Maps of the Annual Youth Suicide Rate and Health Professional Shortage Areas (HPSAs) for Mental Health, 2015 to 2016.
A, County-level annual suicide rate per 100 000 youth 5 to 19 years old from 2015 to 2016. Color gradation cut points represent the 50th, 75th, 90th, 95th, and 99th percentile of the distribution of annual youth suicide rates by county. B, County HPSA designation for mental health. C, Mean county HPSA score for mental health from 2015 to 2016. HPSA scores range from 0 to 25; higher scores indicate higher degrees of mental health professional workforce shortages. Color gradation cut points represent score quartiles among counties assigned an HPSA score.

