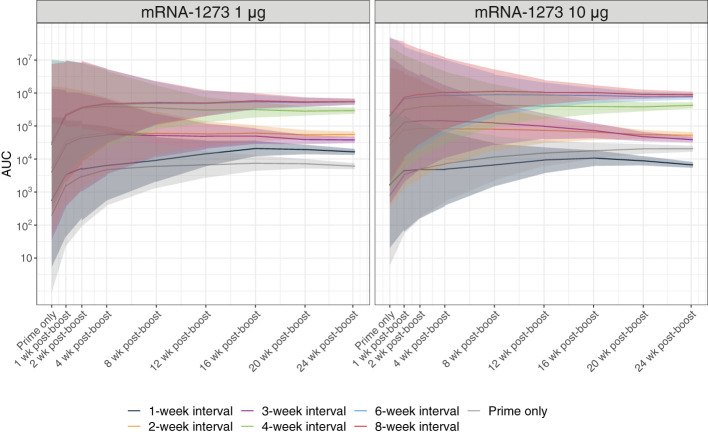
Figure 3.
Antibody Fc-effector Function Responses. Antibody Fc-effector function was assessed using reporter cells expressing the murine FcγRIV. Predicted serum Fc-effector responses from before dose 2 through 24 weeks after dose 2 (with corresponding 95% CIs [shaded region]; based on a Bayesian GAM with days after dose 2 as a continuous variable [see Methods for details]) are presented by dosing interval (prime only, 1-, 2-, 3-, 4-, 6-, or 8-week intervals between doses) for 1-µg or 10-µg dosing levels (n=8-10 mice per group). Results of statistical comparisons between groups based on the Bayesian GAM are presented in Table S2 and Figure S5 . Observed data at individual animal level are shown in Figure S4 . AUC, area under the curve; CI, confidence interval; GAM, generalized additive model; mRNA, messenger RNA.

