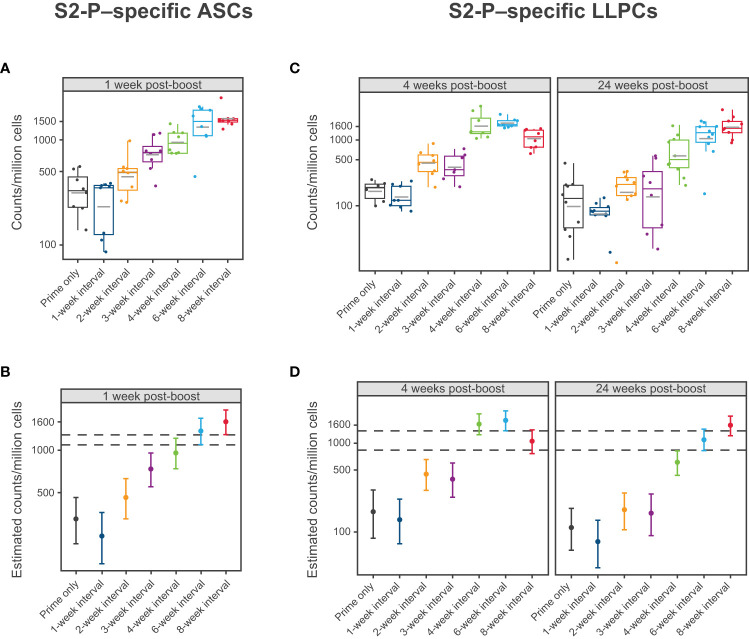
Figure 4.
S2-P–specific Antibody Secreting Cells and Long-Lived Plasma Cells. (A, B) Levels of S2-P–specific ASCs 1 week following dose 2 of mRNA-1273 10 µg are presented by dosing intervals (prime only or 1-, 2-, 3-, 4-, 6-, or 8-week intervals between doses). Panel (A) presents individual animal-level data with dots corresponding to individual animals and grey horizontal lines denoting the average within each group. Panel (B) presents the estimated mean and associated 95% CIs based on a statistical model (see Methods), with error bars representing the 95% CI of the estimated mean. (C, D) Levels of S2-P–specific LLPCs 4 weeks and 24 weeks after dose 2 of mRNA-1273 10 µg are presented by dosing intervals (prime only or 1-, 2-, 3-, 4-, 6-, or 8-week intervals between doses). Individual animal-level data (dots corresponding to individual animals and grey horizontal line denoting the average within each group) are shown in panel (C). Panel (D) presents the corresponding estimated means and associated 95% CIs based on a statistical model (see Methods), with error bars representing the 95% CI of the estimated mean (n=8-10 mice per group). Results of statistical comparisons between groups based on the statistical models are presented in Table S3 , Table S4 , and Figure S6 . ASC, antibody-secreting cell; CI, confidence interval; LLPC, long-lived plasma cell; mRNA, messenger RNA.

