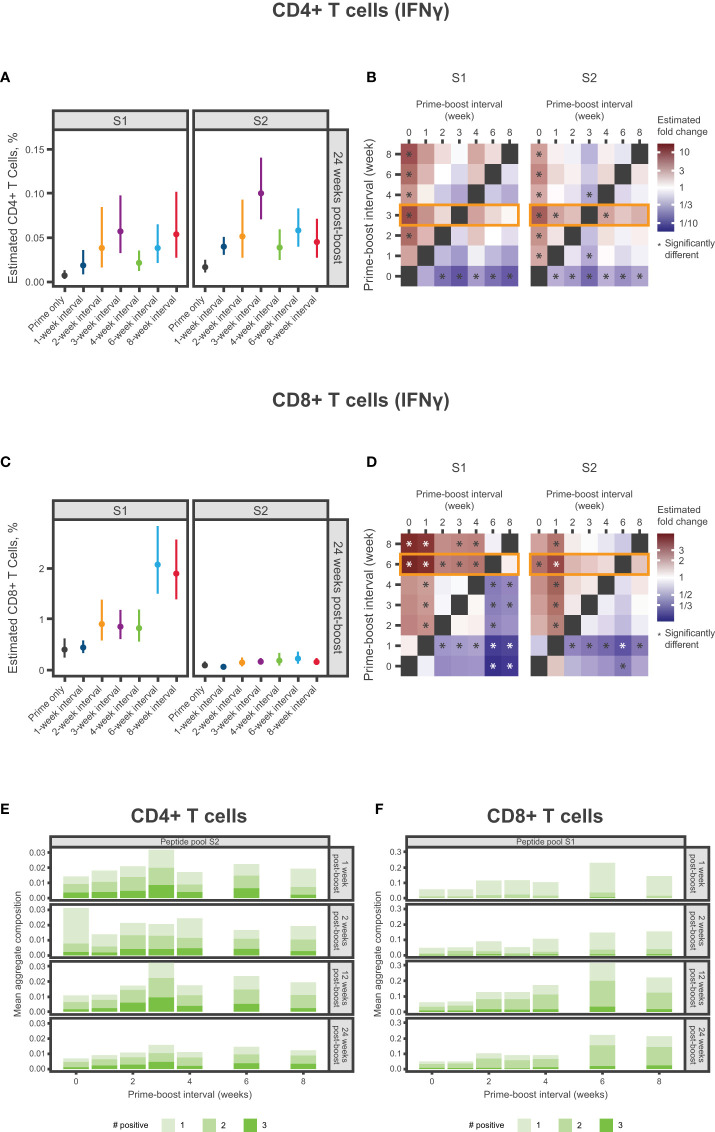
Figure 5.
Spike-specific CD4+ and CD8+ T-Cell Responses. (A-D) Percentage of SARS-CoV-2 spike-specific IFNγ-producing (A) CD4+ T cells or (C) CD8+ T cells at 24 weeks after dose 2 according to antigen (S1 and S2) and mRNA-1273 dosing interval (prime only or 1-, 2-, 3-, 4-, 6-, or 8-week intervals). Panels (A, C) present the estimated mean and associated 95% CIs based on a statistical model (see Methods), with error bars representing the 95% CIs of estimated means. Panels (B, C) present the same results in heatmaps showing fold change between percentages of spike-specific IFNγ-producing (B) CD4+ T cells or (D) CD8+ T cells at 24 weeks after dose 2. Significant differences denoted by an asterisk if the P-value was less than 0.05. Results of statistical comparisons between groups are presented in Table S5 , Table S7 , Figure S7 , and Figure S10 . (E, F) Mean aggregate composition of CD4+ T-cell IFNγ response to the S2 peptide pool or CD8+ T-cell IFNγ response to the S1 peptide pool are presented by mRNA-1273 dosing interval at 1, 2, 12, and 24 weeks following dose 2. Data are presented as averages of individual mice (n=8-10) within each dosing interval group and time point. These compositions were obtained from a thresholding modeling that accounted for day- and cell type–specific differences (see Methods and Supplementary Methods ). Results of statistical comparisons between groups based on a zero-inflated beta regression model (see Methods) and shown in Table S6 , Figure S9 , and Figure S11 . Individual animal-level data are presented in Figure S8 . CI, confidence interval; IFNγ, interferon γ; mRNA, messenger RNA; S1, subunit 1; S2, subunit 2; SARS-CoV-2, severe acute respiratory syndrome coronavirus 2.

