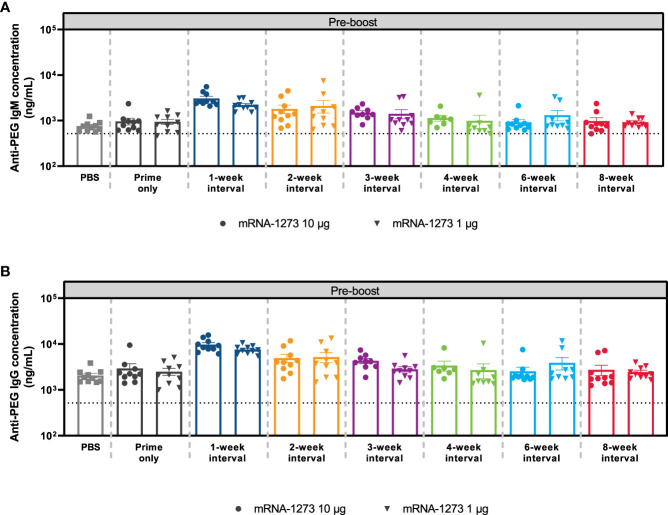
Figure 6.
Anti-PEG Antibody Responses. The mean ± SEM concentrations of (A) anti-PEG IgM and (B) anti-PEG IgG antibodies at Day 56 (before dose 2) are presented by mRNA-1273 dosing interval schedule (prime only or 1-, 2-, 3-, 4-, 6-, and 8-week intervals) with n=8-10 mice per group. Results of corresponding statistical comparisons between groups are shown in Table S8 and Figure S12 . IgG, immunoglobulin G; IgM, immunoglobulin M; mRNA, messenger RNA; PEG, polyethylene glycol; PBS, phosphate-buffered saline; SEM, standard error of the mean.

